To use the Console more effectively, you need a powerful SEO analysis tool. There may be is a javascript error in your browser console or any other problem. You have the chance to track all the problems on Screpy, along with other issues that you need to optimize your website for higher quality.

How to fix the errors that the browser has alerted?
In order for your website to work with the highest functionality and gain rank in Google and other search engines over time, you need to fix all the errors you view through Screpy one by one. Screpy can be your number one assistant for this. There are several different tools in this wide selection, which allow you to find out exactly what the source of the given alert is. How? Here is how:
- There is a call stack section under text for each error that comes to you in the console. In this section, you explore error with the Devtools Console system.
- This system allows you to view the underlying code snippet that caused the error, displaying the erroneous area in the upper right corner of the tile.
What about seeing an example?

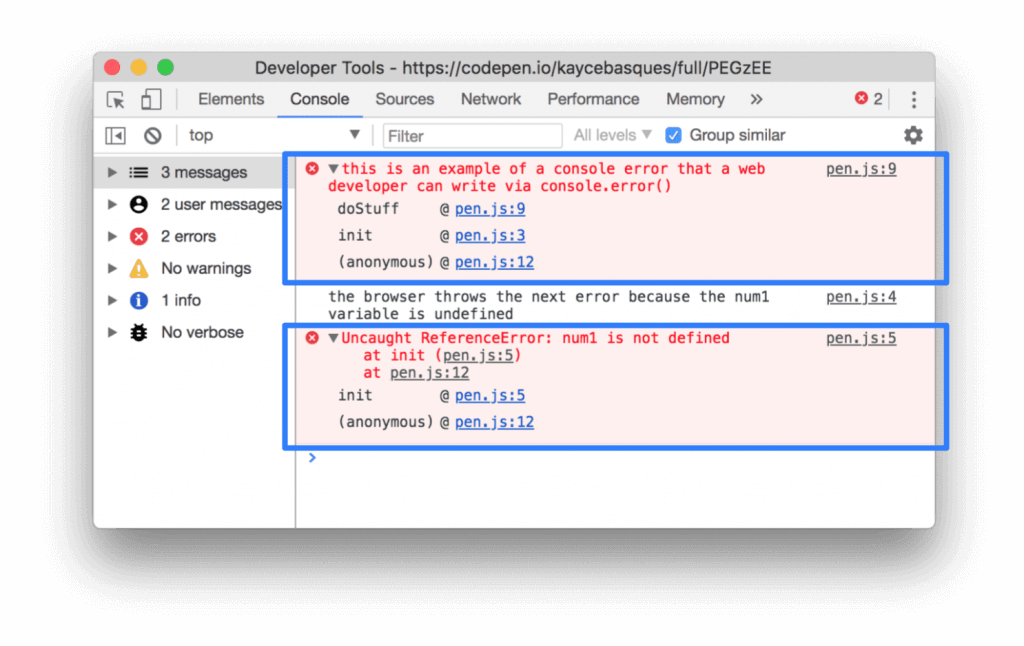
Let’s briefly examine this process through the example above. In Google DevTools, an error notification comes first in the Console section. The first error comes from the web developer. The second error is sent directly by the browser. This error notification shows that one of the variables found in the original scripts of the page does not exist.
The user who sees the above errors can follow the call stack under each error. In this area, there is a detailed presentation in order to understand the area where the error occurred. For example, in the above image, the code error presented to you in Console is an anonymous function and it is also called the doStuff function. The user clicks on the information in the upper right corner to find the code causing the error in this function. In the image, this code is given with the link as ‘’pen.js: 9’’.
If you do not fully understand the cause of the error despite the hints given on the system, you can try to find results by searching the error code on search engines. Moreover, you can search for a solution by sharing the web browser console error that appears on the platforms where the developers are together.
Sometimes it may not be possible to solve the problem in coding despite the detailed research you do. In such a case, you can wrap the code with “try ... catch” to indicate that you are aware that there is a problem with the code. In order to resolve this issue, do not forget to constantly monitor console notifications while continuing your research.
Why Solving Console Errors is Beneficial for My Website?
Coding problems on your website will lower your website’s SEO score. But often it is important to diagnose them before solving them, to find out exactly where the problem lies. When you use Lighthouse in your search for SEO software tools, you can easily view the code that each problem is relevant after you get information on the panel, and you can prevent possible problems with your website.