


Primary landing pages
Monitor pages that introduce the product, service, or campaign because a slow first experience can affect both discovery and conversion work.
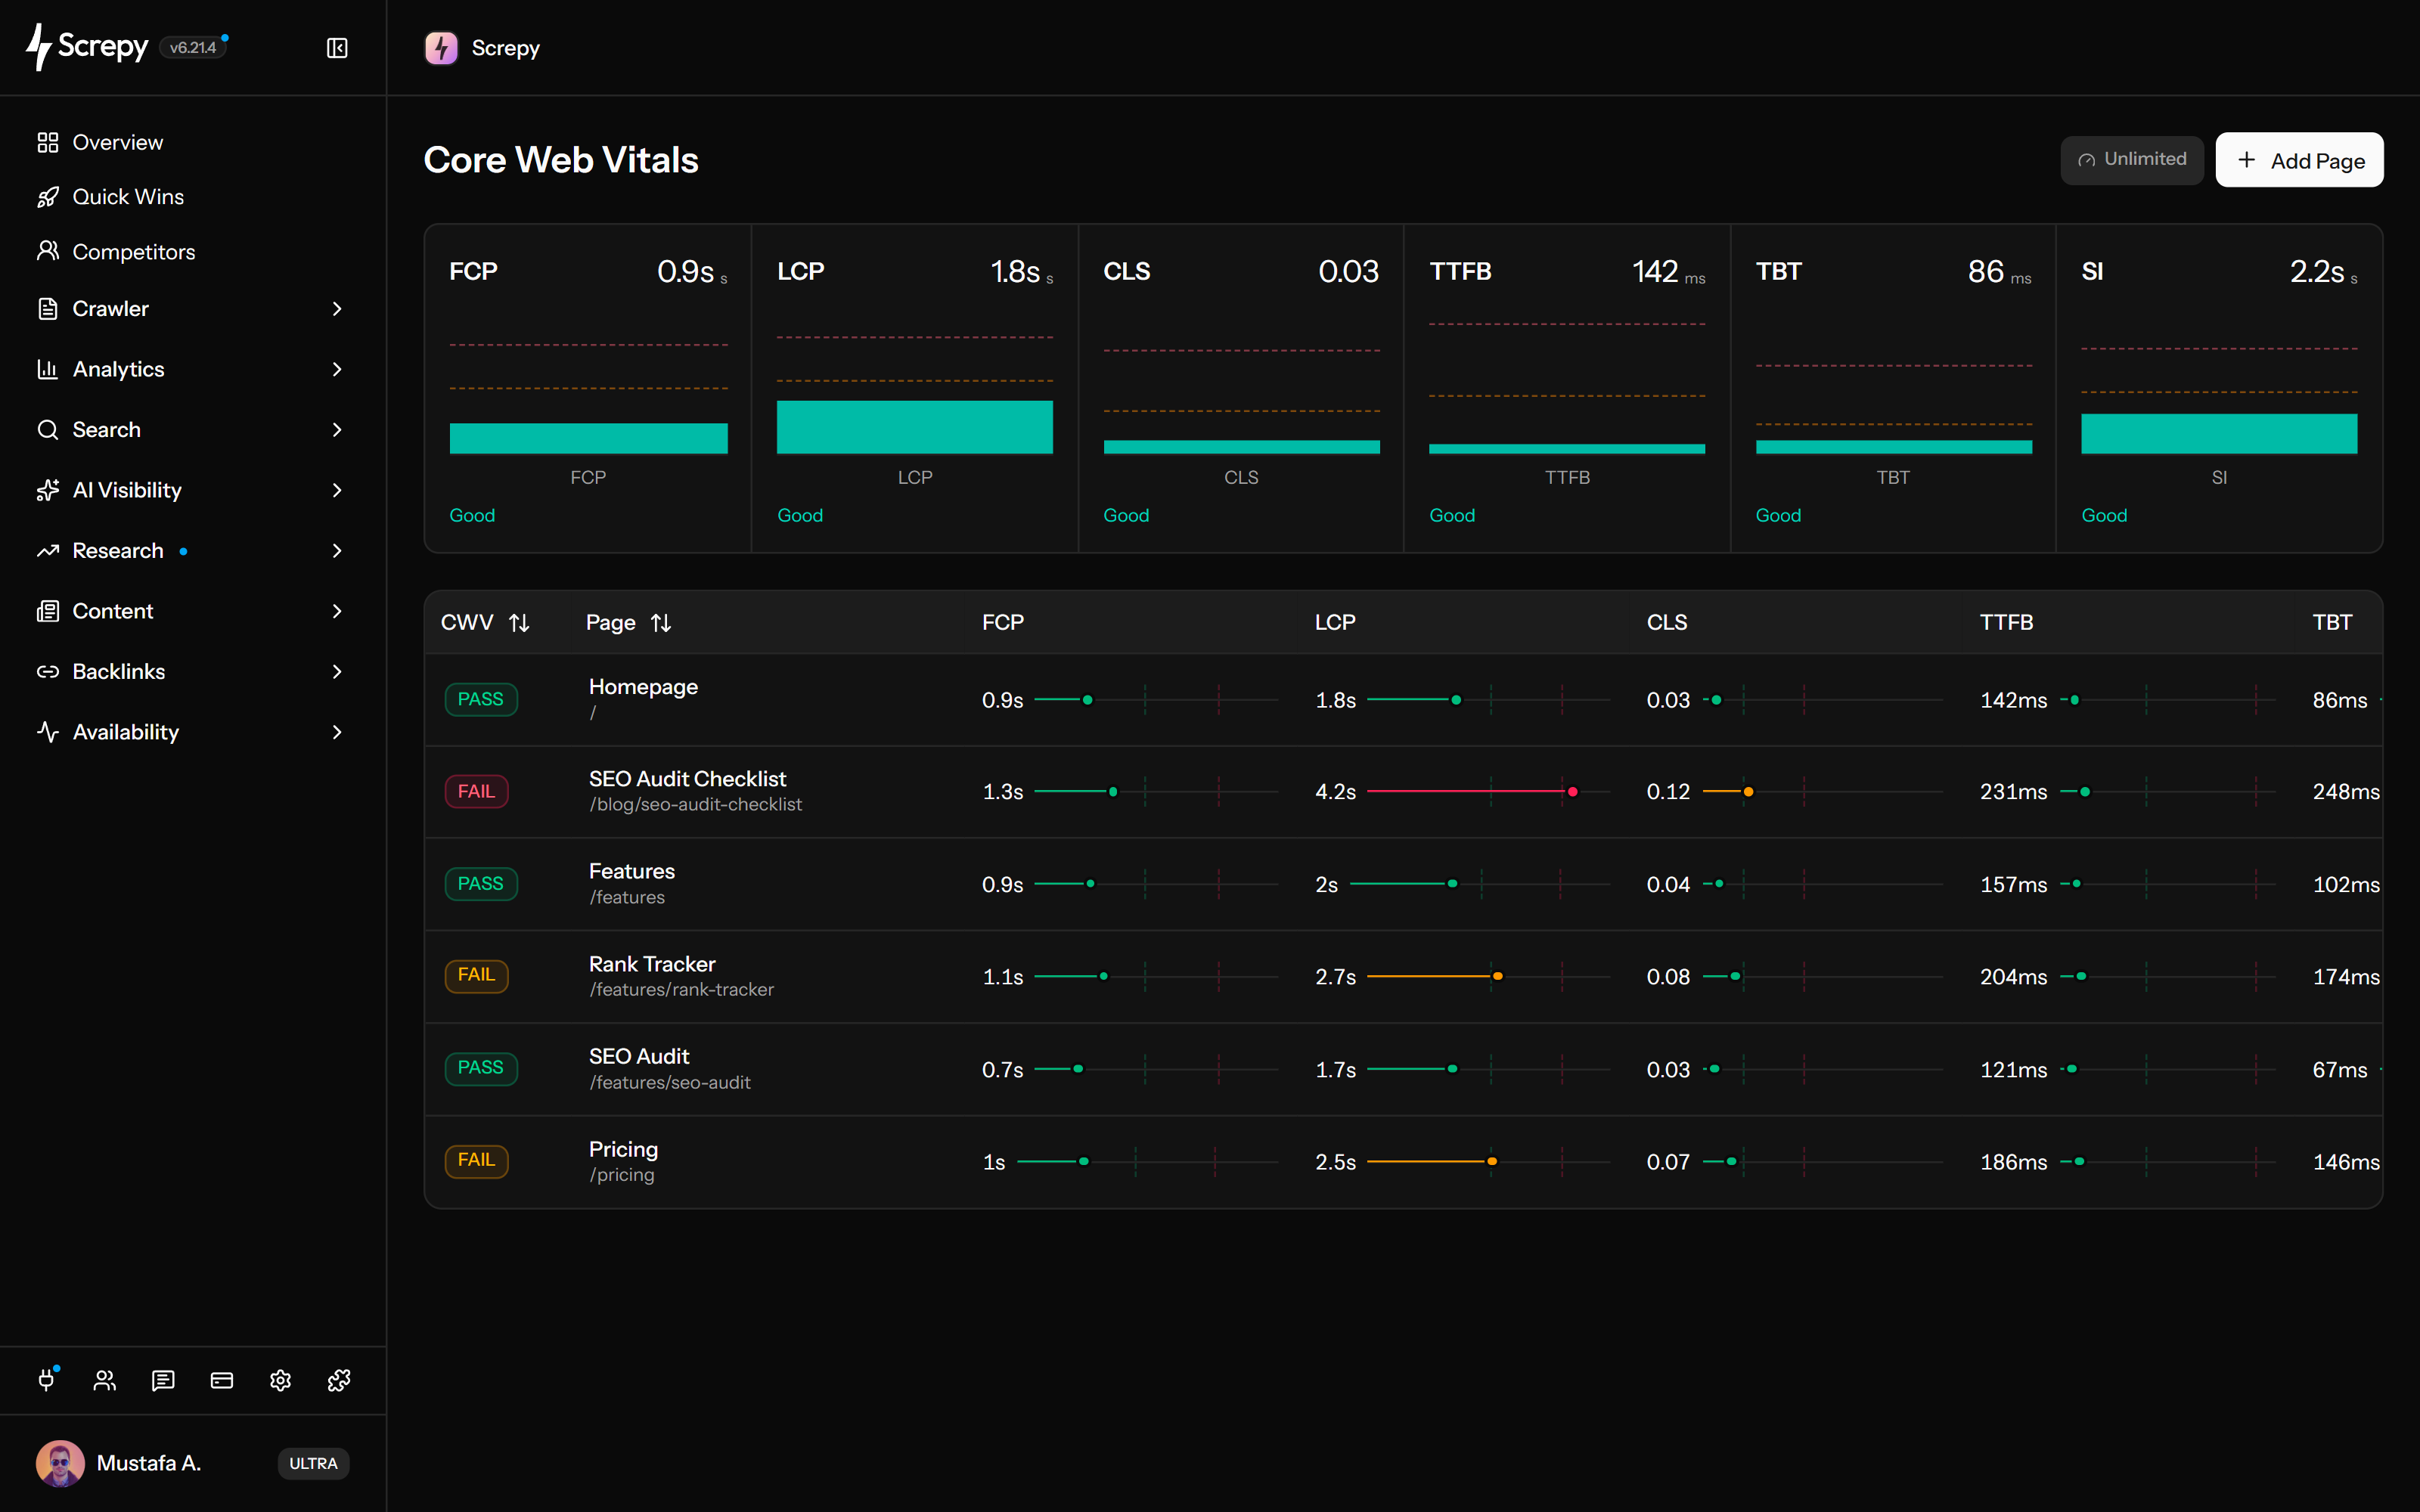
Track LCP, CLS and loading diagnostics for selected public pages on your project domain. Review five metrics per URL and a separate homepage summary with Speed Index, then check a focused fix against a later lab result. These are controlled tests, not real-user field data.
Find selected URLs where the main content appears late.
Review unexpected layout movement on selected URLs.
Record the current values and review a later lab result after a focused fix.










Largest Contentful Paint measures when the largest eligible image, text block or video becomes visible in the test viewport. Use the LCP value for each monitored URL to decide which page needs a closer loading investigation.
example.comLab
LCP2.1 s
A page can load quickly and still move a button or paragraph unexpectedly. Cumulative Layout Shift gives each monitored URL a lab stability score so you can investigate movement separately from loading speed.
CLS
0.04Total Blocking Time helps you spot main-thread work that can delay input during loading. Read the TBT value alongside LCP and FCP: content appearing quickly does not necessarily mean the page can respond promptly.
example.comLab
TBT180 ms
First Contentful Paint marks the first visible content; Time to First Byte marks the start of the response. Reading both for the same URL helps you separate an early response delay from time spent getting content onto the screen.
Lab2,100 ms
Track a manageable set of public pages from your project rather than treating a single homepage result as the whole site. Use the plan's project allowance for pages where loading or layout problems would matter most.
example.comLab
/1.4 s/shop/linen2.8 s/guides/seo1.9 sThe summary above the URL table uses the project's checked homepage. It brings the current lab measurements together, including Speed Index, while the table beneath it keeps the five displayed metrics tied to each monitored URL.
example.comLab
LCP2.1 s
TBT180 ms
CLS0.04
Active eligible pages become due for another scheduled check after a day. Review the current result after a focused change, allowing for plan eligibility and check availability rather than expecting a test at an exact clock time.
Bring the saved homepage lab overview into an AI conversation or a REST integration. Ask for an explanation of the available measurements and a focused investigation, with the evidence kept separate from a proposed fix.
/projectsJSON{
"data": [
{ "domain": "example.com" }
]
}Read your project's saved homepage lab overview through SEO MCP. Explain available metrics with the homepage URL and check time, then choose what to investigate without claiming an all-page report or a new test.
Keep the URL and measurement method stable, use the weakest metric to narrow the investigation, and validate one change with a later check.
Choose public URLs on the project domain or its subdomains. Start with the homepage, a conversion-entry page and a representative URL from an important template, within the project's plan allowance.
Eligible active URLs receive recurring scheduled lab checks. After the first attempt, review the available FCP, LCP, CLS, TTFB and TBT values for the tested URL; the separate homepage summary also includes Speed Index.
Use the weak metric to choose a specific investigation: LCP for main-content loading, CLS for unexpected movement, TBT for blocking work, and FCP with TTFB for early loading. Homepage Speed Index adds visual-progress context, not proof of a cause.
Record the current values before a focused change, keep the tracked URL stable, then compare a later scheduled result. The panel shows current measurements, so retain your earlier baseline separately and investigate repeated changes rather than treating one fluctuation as proof.
A small, representative URL set is easier to investigate than a dashboard full of low-value pages. Start with business-critical journeys and reusable templates.
Monitor pages that introduce the product, service, or campaign because a slow first experience can affect both discovery and conversion work.
Choose one representative product, category, article, or documentation URL to expose performance problems that may repeat across the same template.
Keep pricing, signup, lead, and checkout entry pages visible when scripts, embeds, experiments, or third-party tags change their performance.
Track URLs affected by redesigns, framework changes, new media, tag-manager updates, or delivery changes before rolling the same pattern out more widely.
Screpy is designed to make recurring performance checks actionable. These boundaries keep the result accurate when field data, causal diagnosis, or ranking impact is the real question.
Screpy runs controlled page tests. The result does not represent the trailing real-user dataset reported by Chrome UX Report or Google Search Console.
TBT describes blocking work during the measured loading period. INP requires interaction measurements and can be tested in a lab with interactions, but this Screpy feature does not report INP or replace real-user responsiveness evidence.
A poor metric tells you where to investigate. Confirm the actual element, request, script, template, or server behavior before deciding what to change.
Good page experience supports users and search quality, but it does not replace relevant content, crawlability, indexing, links, or other search signals.
Monitor selected URLs for recurring lab results, audit the wider website for repeated technical patterns, or read the measurement methodology before comparing Screpy with a field-data report.
Monitor selected public project URLs with recurring lab checks; review five table metrics and the separate six-metric homepage summary.
Crawl the wider website for links, images and on-page issues around an affected URL or template. Use those findings as technical context, not as a performance trace.
Understand the scope, timing, and limits of Screpy lab data before comparing it with real-user field reports.
Screpy documentation
Use the guide to select monitored URLs, read the lab metrics and distinguish them from field data. Record a baseline separately before checking a focused improvement against a later result.
Learn the concepts behind this workflow and apply them with practical SEO guidance.
Learn what Core Web Vitals are, why they matter for SEO and UX, and how LCP, FID, CLS, and page performance affect website quality.
Read articleLearn what page experience means, why Google updates matter, and how Core Web Vitals, UX, mobile usability, and speed affect rankings.
Read articleLearn how soft navigations affect LCP, INP, and CLS in experimental CrUX data, compare reports, and separate measurement changes from real speed gains.
Read articleFix render-blocking resources using critical CSS, defer/async JavaScript, and preload hints to improve Lighthouse audits and Core Web Vitals on real pages.
Read articleUnderstand lab versus field data, LCP, CLS, TBT, supporting speed metrics, daily checks, URL selection, verdicts, and the limits of page-experience claims.
Start with the homepage, important public landing pages, conversion-entry pages and one representative URL per important template. Added URLs must belong to the project domain or its subdomains and fit the plan allowance. Monitoring a template sample does not test every page using that template.
This feature measures page loading and provides TBT as a blocking diagnostic; it does not measure the interactions needed for INP. INP can be tested in a lab by performing interactions, but a TBT value is not an INP value and does not describe every interaction after loading.
No. Screpy reports controlled lab measurements for the checked URL. Field data from Chrome UX Report or Google Search Console reflects real visits over a rolling collection period and can differ because devices, networks, geography, and user behavior vary.
No. Google recommends good Core Web Vitals for users and Search, but page experience is only part of a much broader set of signals. Relevant content can still rank with weaker page experience, and a fast page is not guaranteed to rank.
Active eligible URLs become due for another scheduled check after one day. Your project's plan and check availability affect completion, so this is not a guarantee of a result at the same clock time every day. A new URL appears in the results table after its first check attempt.
Google currently defines Largest Contentful Paint, Interaction to Next Paint, and Cumulative Layout Shift as the Core Web Vitals. Screpy measures LCP and CLS in its lab checks and reports TBT as a lab responsiveness diagnostic alongside FCP, TTFB, and Speed Index. It does not present TBT as INP.
Screpy's monitored-URL table shows lab FCP, LCP, CLS, TTFB and TBT. The checked homepage summary adds Speed Index. The table uses a lab PASS/FAIL verdict; authenticated API and MCP responses also expose the saved homepage URL and check time. These are not real-user field measurements.
No. Screpy's table verdict uses the worst available lab LCP, CLS and TBT classification and can still have missing values. Google's field assessment uses real-user Core Web Vitals data, including INP, with its own coverage and percentile rules. Inspect the available metrics and the relevant field report before drawing that conclusion.