HomeTasks

Tasks

To use the Console more effectively, you need a powerful SEO analysis tool. There may be is a javascript error in your browser console or any other problem. You have the chance to track all the problems on Screpy, along with other issues that you need to optimize your website for higher quality.

Console Logs

How to fix the errors that the browser has alerted?

In order for your website to work with the highest functionality and gain rank in Google and other search engines over time, you need to fix all the errors you view through Screpy one by one. Screpy can be your number one assistant for this. There are several different tools in this wide selection, which allow you to find out exactly what the source of the given alert is. How? Here is how:

  • There is a call stack section under text for each error that comes to you in the console. In this section, you explore error with the Devtools Console system.
  • This system allows you to view the underlying code snippet that caused the error, displaying the erroneous area in the upper right corner of the tile.

What about seeing an example?

Console Errors

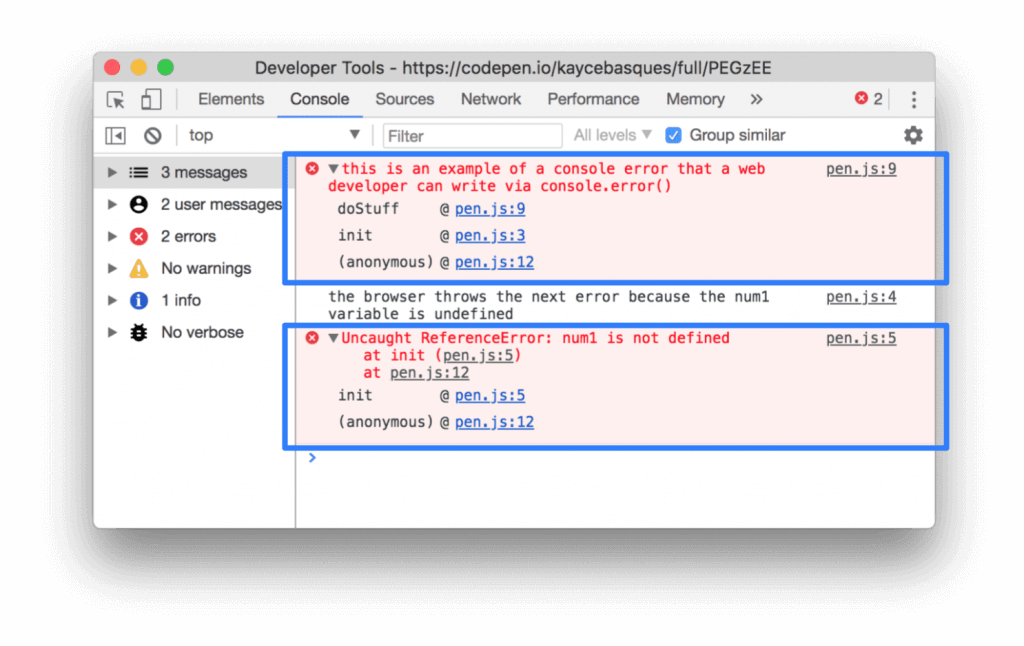
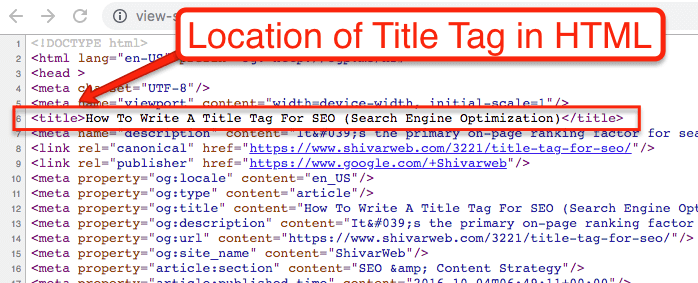
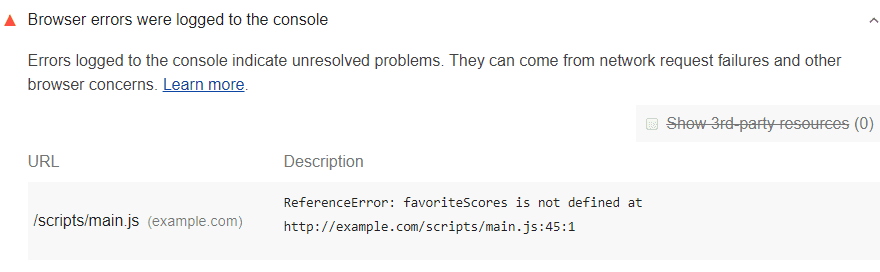
Let’s briefly examine this process through the example above. In Google DevTools, an error notification comes first in the Console section. The first error comes from the web developer. The second error is sent directly by the browser. This error notification shows that one of the variables found in the original scripts of the page does not exist.

The user who sees the above errors can follow the call stack under each error. In this area, there is a detailed presentation in order to understand the area where the error occurred. For example, in the above image, the code error presented to you in Console is an anonymous function and it is also called the doStuff function. The user clicks on the information in the upper right corner to find the code causing the error in this function. In the image, this code is given with the link as ‘’pen.js: 9’’.

If you do not fully understand the cause of the error despite the hints given on the system, you can try to find results by searching the error code on search engines. Moreover, you can search for a solution by sharing the web browser console error that appears on the platforms where the developers are together.

Sometimes it may not be possible to solve the problem in coding despite the detailed research you do. In such a case, you can wrap the code with “try ... catch” to indicate that you are aware that there is a problem with the code. In order to resolve this issue, do not forget to constantly monitor console notifications while continuing your research.

Why Solving Console Errors is Beneficial for My Website?

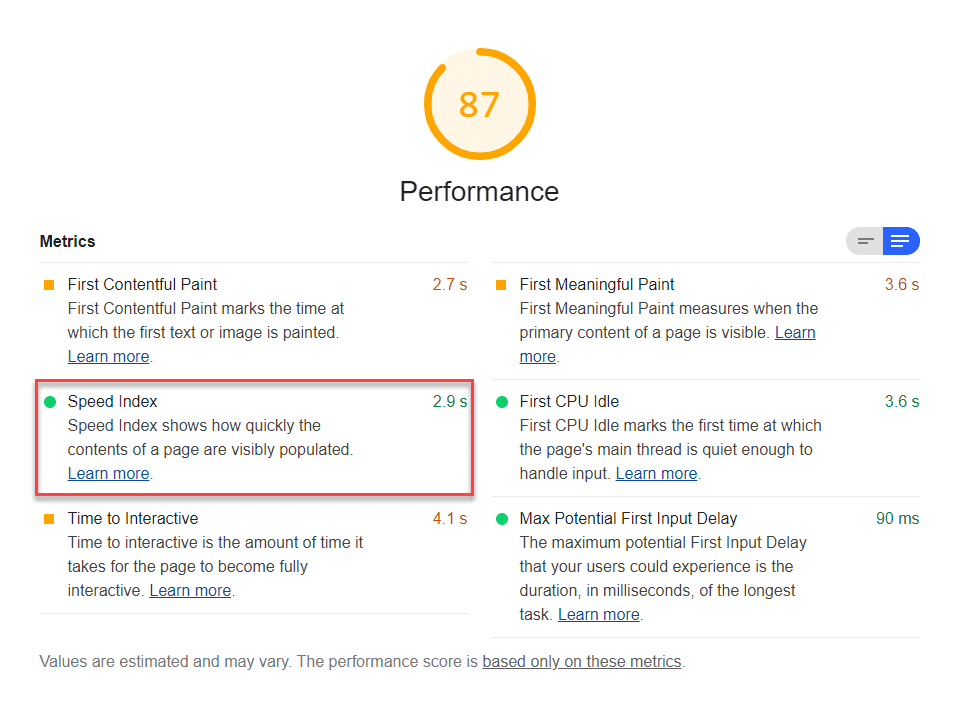
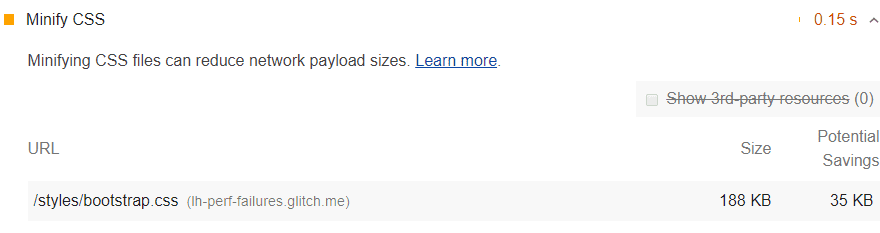
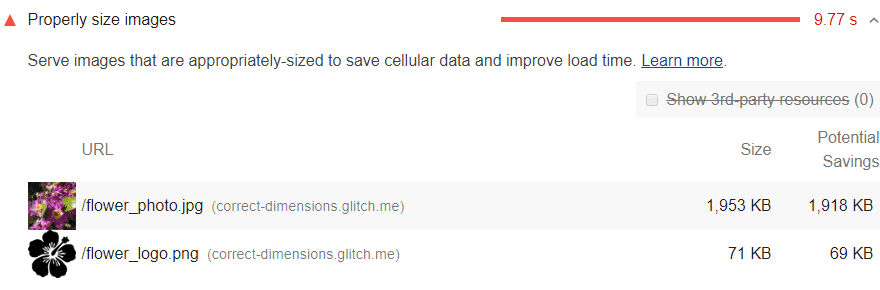
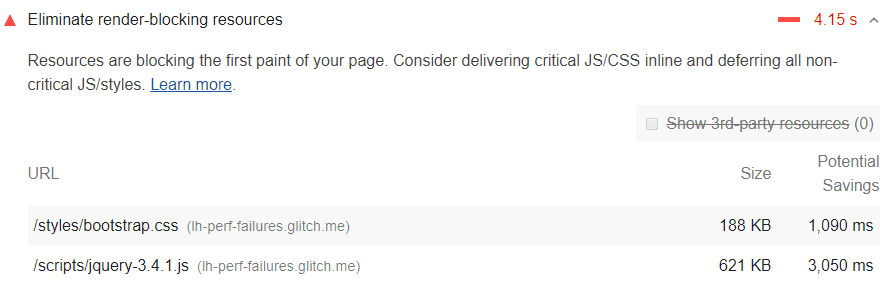
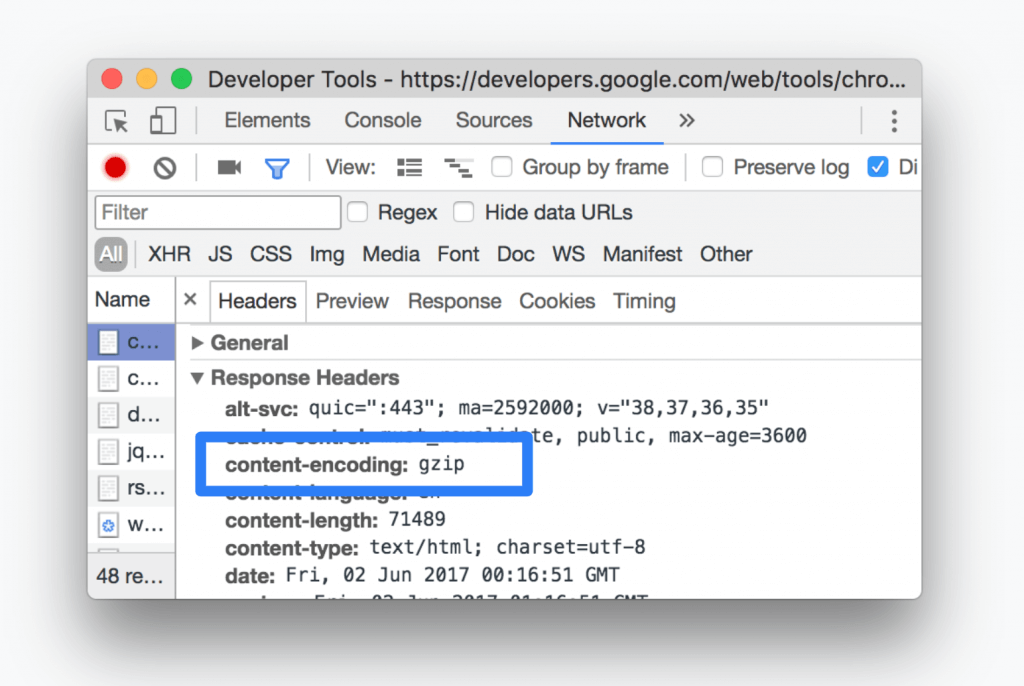
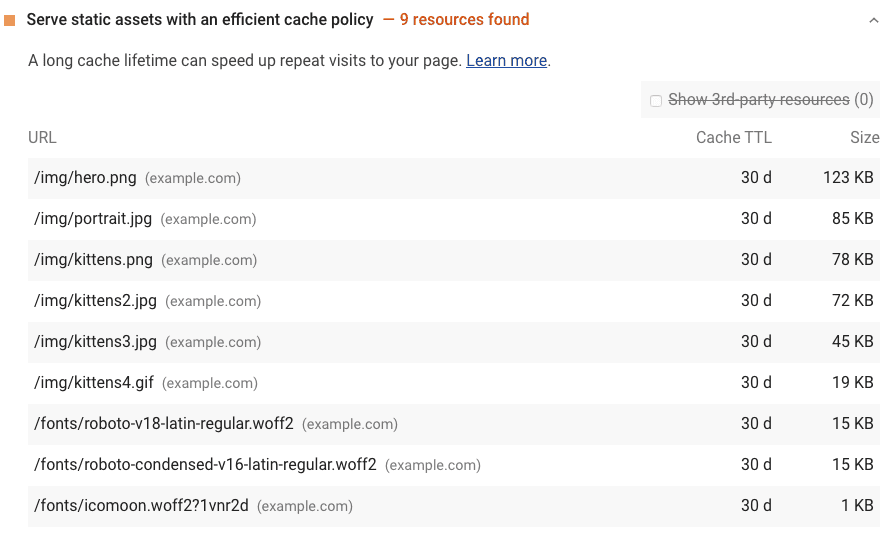
Coding problems on your website will lower your website’s SEO score. But often it is important to diagnose them before solving them, to find out exactly where the problem lies. When you use Lighthouse in your search for SEO software tools, you can easily view the code that each problem is relevant after you get information on the panel, and you can prevent possible problems with your website.

The title tag problem, one of the problems marked as critical, can even cause your organic traffic to drop.

If you don’t have a title tag, start by finding out why it’s missing. A good place to start is to check the templates, scripts, plugins, and more your page has. Is there any negative situation affecting the meta tag in these details? Editing them, if any, will work.

Also, we recommend that you use the main keyword within the meta tag of the page that describes the content on the page.

Title Tag Location in HTML
Title tag location in HTML

Why Title Tags are Important? 

If there is no title tag in any content on your website, you will be given a warning during the audit process. The title tag is a very critical area that provides a shortcut and a clear answer to what is on a web page. This field is important for two core values:

  1. User Experience (UX): When users enter the web page, they can only have an idea about what the page is about in general, what to expect from the page, only with the title tag. Therefore, the absence of the meta tag of the page will mean that the user entering the site has false expectations about what is on the site. This may cause both an increase in bounce rate and a decrease in conversion rates. Basically, all this directly lowers the UX.
  2. SEO: We talked about conversion rates, user experience, and bounce rate. All of these concepts are closely related to SEO. These values, which are affected by SEO and determine SEO in a spiral structure, definitely require you to host the meta tag on your site.
Sitemap.xml Format Error

When you see the warnings regarding the sitemap.xml format errors, you can check whether you are experiencing the following problems:

  • Your sitemap may not have the URL format. In this case, it may not have www or the address of the file in question may have been defined as HTTP instead of HTTPS. However, your sitemap must have the same URL format as your website. So you need to solve this problem urgently.

For this, go to your website dashboard. Follow the steps of Admin> Settings> General one by one. Then click on “Change site URL”. In this way, you will change the relevant protocol.

What is more about Sitemap.xml files format errors?

A little clue: If you have recently made changes to the format or format of the URL, there may be incorrectly formatted addresses in your website’s database. In this case, you will have to make the corrections step by step from the oldest to the newest. Remember that for this you need to back up your database.

  • It is also possible to get a warning about the unsupported format on Google Search Console. If your file looks like any other HTML page, this will result in this warning. The reason for this is that when using W3 Total Cache, you hide the sitemap for standard visitors. This situation negatively affects the sitemap format. You can set a new user agent group to avoid this situation.

After you complete your checks on the above two different format problems, run your re-audit. You will notice that the problem has been resolved. Generally, sitemap.xml format errors are caused by these.

Robots.txt Not Found

If the warning you received says that the robot.txt file cannot be found on your site and therefore the whole site will be scanned in an uncontrolled manner, you should prepare a file by paying attention to the following details:

  1. Your robot.txt file must be located in the root directory of your site.
  2. The URL of the robot.txt file must be in the same format as your website URL.
  3. While preparing the robots.txt file, you should complete your work by adhering to the UTF-8 character encoding discipline.

Checklist for solving robots.txt not found problem

Did you pay attention to the warnings above? After preparing your file, you can make a check according to the following items:

  1. Your robots.txt file should be plain text.
  2. There should be no characters other than UTF-8 encoding system in the file.
  3. You can add dynamic or variable content to the file. Also, the file itself is dynamic and can be changed at any time.
  4. Keep the file running at all times. Hiding or removing the file may result in unplanned results in the crawling process of your website.

How to determine the URL of the Robots.txt file? 

We said that the URL of the robots.txt file should be in the same format as your site address. So what exactly does this mean? Here is a small example of this:

  1. Site URL: https://www.yourwebpageaddress.com/
  2. Robots.txt URL: https://www.yourwebpageaddress.com/robots.txt
  1. Check the page code. If your page contains the <meta name = "robots" content = "noindex" /> directive, it means that the browser will pass the page without crawling. You need to uninstall this code snippet.
  2. Check no follow links. Sometimes your browser indexes your content but does not follow the links in this directory. This situation also causes problems. Make sure the following codes are not on the page:
<meta name="robots" content="nofollow"
href="pagename.html" rel="nofollow"/>
  1. The robot.txt on your web page may cause the indexing process to be blocked. If there is a field like the following in the source code of your web page, it will be useful to get rid of it immediately. Because this type of code means that all pages on your website are blocked from being indexed, and even if you do optimization work, these are useless because crawlers cannot crawl your site.

User-agent: *

Disallow: /

  1. Besides the code above, a code like the one below also means that many pages on your site, if not your entire site, cannot be indexed. If there is a part like this in your website HTML code, you need to delete it too.

User-agent: *

Disallow: / products /

If you are sure that such parts do not exist in the code structures on your website, what you need to do this time is to make sure there are no internal broken links, URL errors, outdated URLs, pages with denied access. You can get information about the current status of all pages thanks to the page scans of Screpy.

Why having a meta description is important? 

Meta description has not yet been proven to have a direct impact on SEO. However, in SERP, users definitely take a look at this area before deciding which page they want to enter. 

So you have to convince them that you have what they’re looking for. On a web page with an empty meta description section, Google randomly determines the fields it will display on the SERP. This creates the impression of an unreliable website that lacks useful information. In order not to experience this situation, you must have a meta description for each of your web pages.

How to pass the audit? – Adding a meta tag on the webpage

In order for your web page to have a meta description, you need to add it between the <head> tags of the relevant page. You can add meta descriptions to the space reserved on the panel –such as WordPress- without the need to have any knowledge about coding languages. In addition to that, this is an extremely simple process that can also be performed directly from the code page.

After defining the meta description, the number of users coming to your site via SERP will likely increase. Because more people will see your site as “the place to find what they’re looking for”.

If you want to optimize the Text to HTML ratio, do the following:

  1. Make sure your HTML source code is valid
  2. Get rid of non-working or unnecessary code
  3. If there are white spaces in your source code, remove them
  4. Remove unnecessary tabs from your site
  5. No comments in the code
  6. Resize and compress images
  7. Compress texts
  8. You will benefit if the size of a web page is less than 300 kb
  9. Styling your page using CSS
  10. Use internal links on your website
  11. If the text ratio on your website is very low, try to enter a content marketing process. Explain more, show more. But be careful to be simple and understandable.

Why optimizing text – HTML ratio is important? 

Better text – HTML ratio,

  1. Means a better user experience. The higher the text to code ratio, the higher the user experience because the user will find something on your website to encourage them to convert.
  2. Means better page load speed. Less code means that unnecessary elements that slow down the loading speed of the web page are removed from there. A stronger loading speed can also mean a better SERP ranking.
  3. This means that the indexing processes of your website will improve. How does? Imagine pages that are faster, have higher conversion rates, more content. Google loves this and raises your page in the ranking. Indexing happens more quickly.

Are you getting an error saying H1 tag not found on your website? Solve the problem now with Screpy! Let’s see how to pass the H1 not found audit.

  1. Click on the HTML code page of the content found on your web page. Which sentence is the title expressing the main subject of the content? Decide on this. If you posted your content without a title, you need to add a title.
  2. Preferably create a title with keywords, striking, far from click-bait, and matching recent SEO trends.
  3. Easily make H1 markup from the panel on your web page (eg WordPress panel). If you do not have such a panel, enter the HTML code page and place the <h1> tag at the beginning of that sentence and the </h1> tag at the end. In this way, you will have H1 on the page and you will go through the audit.

Is the problem with the H1 tag only?

There are many rules you need to follow regarding H tags on a web page. Check it out briefly below;

  1. There should not be more than one H1 tag on a web page.
  2. After the H1 tag, you should not go directly to h3 without using h2.
  3. After a sentence with the H1 or h2 tag, another H tag should not be used without standard text. Otherwise, the relevant title will be perceived as empty.
  4. Sentences to which H tags are assigned must not contain special characters (e.g. bullets, sequential clauses, or other special characters)

When you receive the 4XX error code for canonical links on your website, you need to understand this: The page that the link points to may not accessible to the browser –for various reasons. Therefore, indexing cannot be performed. Failure to perform indexing may mean that increasing the ranking is just a dream. So, in order to optimize your SEO score, you need to fix the canonical unsuccessful status code problem as soon as possible.

What can be done to pass the canonical unsuccessful status code audit?

So what should be done to solve this problem?

400 – Bad Request

This error indicates that there was a problem receiving requests between the server and your browser. Check for URL errors.

401 – Unauthorized

Canonical links fail on pages that can be viewed by users logged in to your page, but where everyone else is considered unauthorized. Then make the page public or remove the canonical link.

403 – Forbidden

You may get this error if the web page you marked with the canonical link is banned for a certain audience. There are two things you have to do: If you insist on having the page forbidden, remove the canonical link from the page. If you wish, make the page accessible to everyone.

404 – Not found error

The most common problem for canonical links and other web page errors is undoubtedly the 404 problems. You can get this warning when the URL of the relevant page changes or the page is deleted. So you need to check the URL.

When you encounter a canonical not found issue, you can use two different alternative solutions to solve the problem:

  1. Let the page you redirect the browser to be page B and the first page to be page A. Are there any chances for page B to be revived and rolled out? If there is such a possibility, start optimizing the page immediately and do not make any changes on the canonical link. It will be sufficient to make the page live again.
  2. If you think the page is not curable, you need to edit the canonical link. Make sure that the URL on page A goes to page A again. In this way, the problem will be eliminated because the canonical link redirects to an already existing page.

Why should you use rel = canonical?

So, optimizing rel = canonical is important. But why? Here are the benefits of rel = canonical links. 

  1. If there is a duplicate content status on your website, the best way to index only one of them is to use canonical links for telling the browser that you are aware of the situation and that they should be found due to functional differences.
  2. When you use canonical links, even the duplicated page remains accessible to users at all times.

If you get a warning that the canonical link is broken, what you need to do is pretty simple. In general, the rel = "canonical" warning indicates that the canonical link on your website cannot redirect your browser anywhere. A broken link means that search engines are not crawling your site correctly. This is why the indexing process is damaged, and some advertising projects you plan for your site may cause budget loss.

  1. When you get a warning that the canonical link is broken, try going to the source URL.
  2. The source URL might have been deleted.
  3. Various changes may have been made to this URL.
  4. Various updates on the system your website is connected to may have caused the links to be broken.
  5. The page linked to the source URL may have been deleted, cannot be found or read.

The error presented as HTTP status code is usually named as 404. This error indicates that the linked page was not found. To solve this problem, consider the things below:

  1. Noindex robots meta tag should not be included in the rel = canonical code.
  2. Make sure you want the rel = canonical URL to be indexed in the search results. If the URL of the base page is shown, this could be the cause of the error.
  3. Add the link rel = canonical to the HTTP header of that page. You can also add it to the <head> section.
  4. Define a rel = canonical link for a single target page. When you redirect the relevant link to more than one page, all links are ignored.

You also have overall score in the Speed Index report provided by Google Lighthouse. Here is a visual of the report in question:

Website Speed Index

What does Speed Index mean? – What does it measure? 

Google Lighthouse’s Speed Index basically measures how quickly a content can be displayed to the user during the page load process. In order to minimize the bounce rate and increase the user experience, the content loading speed will need to be quite high. Lighthouse first takes a video of the page loading process to be able to calculate. It then takes a look at how visual progression works between frames. Moreover, it uses a special module to generate the Speed Index score. You can instantly browse the system called the Speedline Node.js module by clicking on it.

Determining Speed Index Score: What does Google Lighthouse do?

Google Lighthouse compares your average score with other real webpages to determine the Speed Index score. The speed scores of real websites are obtained from the HTTP archive. In order to interpret your speed index score, you are presented with the time in seconds, color-coding interpretation and score value. As follows:

How to pass the audit? – Improving the Speed Index score

In order to improve your stated Speed Index score, you should not run a random optimization process. We strongly recommend that you take a look at the Diagnostic audits to get the results with the highest efficiency level. For example, the following improvement actions generally provide high efficiency:

  1. Increasing the speed by minimizing main thread work
  2. Reviewing JavaScript and reducing execution time, thus increasing speed
  3. Defining an alternative font to keep the text visible while webfont load takes place.

Improving overall web page performance score 

If you don’t want to focus specifically on a single metric, it’s also a good option to make improvements to increase the overall performance score. Google Lighthouse has a tab where it lists the factors that will have a strong impact on performance improvement. This tab is called the Google Lighthouse Opportunities. We can say that the best opportunity is the one that will provide maximum impact in one go. Let’s go through an example if you wish. See the following report that presents the very high rate of optimization render-blocking resources can provide:

Website speed Index lighthouse report

Thanks to the following report, which you will see in the opportunities section of Google Lighthouse, it will be very easy to detect CSS files using high bytes.

Did you know that the vast majority of CSS files on your web page are much larger than they should be? Let’s explain this with an example if you wish. Check out the code below:

/* Header background should match brand colors. */
h1 {
  background-color: #000000;
}
h2 {
  background-color: #000000;
}

All of the code you see above can be downloaded into a single line of code that will provide the same functionality. Here is as follows:

h1, h2 { background-color: #000000; }

The two different codes you see above perform exactly the same functions. But while the first takes up much more bytes, the second takes up much less and performs the necessary function. Moreover, removing the whitespace improves the performance of the website. Here is a version of whitespace that has also been removed:

h1,h2{background-color:#000000;}

Some of the tricks and hints are used in order to take the minification process one step further. For example, six-digit color values can also be used in their trivalent form. Using #000 instead of #000000 will accomplish the same purpose.

Google Lighthouse reveals the difference between the two cases by calculating the minified version of the CSS system. According to this calculation, a potential saving value appears. If you start with an audit that has high potential saving values, your performance boost rate can increase much faster. For this, you can first use basic optimization methods, then use different tricks such as the color value optimization we have just mentioned to reduce the already small file size even more.

The report presented by the Google Lighthouse report is as follows. The report, which provides information about the current size of the images and the potential savings to be achieved after optimization, is highly revealing:

Size of images

Lighthouse calculates oversized images: But how? 

The opportunities section of Google Lighthouse usually includes audits that, if optimized, can improve your site’s performance very quickly. Lighthouse makes a comparison to measure the size of the images. Therefore, the measurement is done properly. The system, which calculates the difference between the rendered image and the actual image, ensures that the audit fails when the difference is more than 4 Kib, so you can have the chance to see the problematic part. Remember that rendered size also means device pixel ratio.

How to pass the audit? – Sizing images properly

Problems start to arise when the images on your page are larger than the image versions on the user’s screen. This means you are maintaining a size you cannot offer and bytes used are wasted. Naturally, this slows down your page loading.

To prevent this, you should choose responsive images. These usually allow you to create multiple versions of the same image. This makes it possible to use different versions on different systems, increasing the page loading speed.

Of course, another strategy is to navigate through the CDN settings of the images. It is possible to perform image resizing and optimization over CDNs by using web service APIs. Remember, images having the right size will also positively affect the overall performance of your website. If you’re not sure which image to start with, start with the highest potential savings.

Screpy page speed audit flags and lists the URLs it detects are render-blocking for you. The list is as follows:

reducing render-blocking resources

Which URLs are considered as render-blocking resources and flagged by Google Lighthouse?

Detailed scanning studies of the Google Lighthouse platform have detected two types of render blocking resources. The first of these are scripts. The second is the style sheets.

Among the <script>tags marked as render-blocking resources are:

  1. Under the head tag of the document
  2. Those who don’t have the Defer attribute
  3. Those who do not have the async attribute

Among the  <link rel="stylesheet">tags marked as render-blocking resources are:

  1. Those that do not have a disabled attribute. If the tag in question has this type of attribute, the behavior of the search engine will change. In such a situation, the search engine may have a problem downloading the stylesheet.
  2. Those who don’t have a media attribute. If there is no media attribute owned or the existing option does not match the user’s device, a similar problem will occur.

Identifying critical resources

After detecting render-blocking resources, what you need to do is to mitigate them. For this, it is necessary to determine which problems are critical and which are not. For that, use Chrome DevTools and go to the Coverage tab. On this tab, you can discover non-critical CSS and Js and decide what you want to edit.

Use this tab when you want to load a page or when a page is running. Tab gives you information about how many codes are used in real-time. It also tells you how many have been loaded. In this way, you get a chance to compare and easily notice the codes that prevent rendering. Let’s examine an example of the audit report:

chrome devtools

It’s obvious what you need to do in order to minify the size of your pages. You have to ship what you need among the code and styles. When you come to this page, click on the URL of your choice and easily review that file. You will see that the styles inside the CSS files are marked with two colors. The same is true for codes in Javascript files:

  1. Green colors indicate critical situations. These contain the styles that are absolutely necessary for the first paint. The basic functions of your web page are also supported by them.
  2. Red colors indicate non-critical situations. These codes are not used for basic functions within the page.

How to pass the audit? – Eliminating render-blocking scripts

Have you decided which critical codes are? Now is the time to move the URL preventing this code from running. In this way, the page can be loaded easily.

If there is some non-critical code in the render-blocking URL, you can opt-out of deleting the URL if you wish. A good solution would be to replace the URL using the async or defer attributes instead.

But if you are not using the code in question at all, you should definitely remove it. For this, you can see our remove unused code article.

How to pass the audit? – Eliminating render-blocking style sheets

Way 1: We know that there is an inlining code inside the script tag. Similarly, inline critical styles may be required for first paint in a style block located in the head of an HTML page. All you have to do is load the remaining styles. But be careful about doing it asynchronously and using the preload link.

Way 2: There is one more way to completely reduce render-blocking styles. For this, you need to take these styles and split them into several different files. Each file can be organized by a media query. You will then need to add a media attribute for each stylesheet link. Once you do this, you will see that the browser is blocking the initial paint.

Way 3: Another thing you can do is minify the CSS. As we mentioned before, there can be many ways to do this. But it is enough to remove unnecessary white spaces or unnecessary code and characters in the file. In this way, your users receive a small package instead of a large file.

The Unminified javascript warning on the Opportunities page of the Google Lighthouse system looks like this. Here, you can see the Javascript file’s current size and potential saving if it is minified. 

Unminified Javascript

How to pass the audit? – Minifying Javascript Files

Minifying can be done by getting rid of the white spaces in the files. At the same time, it is a good idea to delete any useless code snippets in the file. You can use Terser for this. The main thing Terser does is to compress the Javascript files on the system and thus reduce the size. In fact, Google Lighthouse does this compression while trying to calculate the potantial saving value and performs an average saving estimate by comparing the previous and next values.

Google Lighthouse flags pages with unused Javascript and presents it to you. As follows:

Remove Unused Javascript

How to pass the audit? – Removing unused Javascript

To do this, you need to detect them first. For this, use Chrome DevTools. Go to Coverage Tab in this tool and perform your transactions line-by-line here. Detecting the unused code process will be automated.

Building a new tool for removing unused Javascript code

You can also use Tooling. Report, which will enable you to remove the javascript code from your website in a healthy way and complete the migration.

When you use this tool, you have the opportunity to check whether the bundler has some additional features that can be used to remove unused code. In this way, you can complete the process much more advantageously. Some of these functions are as follows:

  1. Code Splitting
  2. Unused Code Elimination
  3. Unused Imported Code

Google Lighthouse offers you encoding images efficiently warning within the Opportunities Section and lists the images that need to be optimized for you. Here is an image of the warning in question:

Encoding Images Efficiently

How to pass the audit? – Ways to optimize images

Use the following methods to optimize images on your web page:

  1. Use Image CDN
  2. Use images with compression
  3. Convert GIFs on your page to video formats
  4. Optimize slow loading image files
  5. Take care to use mobile responsive images
  6. Use the correct dimensions for images
  7. Choose images in WebP format

You can also optimize the images on the web page by using GUI tools. 

Google Lighthouse lists all text-based files used uncompressed for you as follows:

Compress Text-Based Elements on the Web Page

Lighthouse Handle Text Compression: But How?

Google Lighthouse scans the data in detail. Among them, it chooses responses that have the following properties:

  1. Elements with text-based resource types
  2. Elements that do not use compression methods such as br, gzip, or deflate
  3. Then, the determined parts are compressed with GZIP by Lighthouse and the total potential saving is calculated by examining their size.

But not all results are listed by Lighthouse. For example, those with the following properties are not listed:

  1. If the original size of the answer is less than 1.4 Kib,
  2. Potential savings when compressed are less than 10 percent of the current size

How to pass the audit?: Enabling text compression on your server

To pass the text compression audit, follow the steps below:

When a browser requests a resource, it will use Accept-Encoding as the HTTP request header. Using this code, what it will do is present the compression algorithm it supports to the user-to you. Like below:

Accept-Encoding: gzip, compress, br

If the browser supports Brotli it might be a good idea to use it. Because Br has the capacity to maximize the saving to be realized by compression. Do a little research on the internet for this. Search for “how to enable Brotli compression” using the name of your server. According to the statements made so far, Brotli is supported by almost all major search engines. Including Explorer, Safari iOS, and Safari Desktop.

Use Chrome DevTools to check if a response is compressed

Using Chrome DevTools, you can check if the compression you make to a response is performed. Follow the steps below:

  1. First, press Control + Shift + J (or Command + Option + J on Mac). This will enable you to open DevTools.
  2. Then use the Network tab.
  3. Then select the request related to your search.
  4. Click on the Headers tab.
  5. Go to the Response Headers section and examine the content-encoding header there.
Compress Text-Based Elements

You can also compare compressed one with other that are not: 

  1. First, press Control + Shift + J (or Command + Option + J on Mac). This will enable you to open DevTools.
  2. Then use the Network tab.
  3. Allow for large request rows.
  4. Review the size part of the response you chose. The top value you will see here is the compression next value and it should be lower. The value below is the size before compression.

Google Lighthouse offers some warnings in the Opportunities section that will allow you to achieve a high rate of improvement if you correct them. The Remove Unused CSS alert also looks like this:

Remove Unused CSS Task

Why Unused CSS Slown Down the Performance? 

One of the best things you can do to add styles inside a page is to add the <link> tag to the source code right after the <head>.

<!doctype html>
<html>
  <head>
    <link href="main.css" rel="stylesheet">
    ...

One of the best things you can do to add styles inside a page is to add the <link> tag to the source code right after the <head>.

The browser downloads the main.css file and this file is tagged as an external style sheet. This is because this file is stored separately from HTML files.

Before a browser can display or process an image in front of the user, it must first complete the necessary operations with all external style sheets. For example, downloading, parsing and processing are the three most basic of these. The browser must ensure that style sheets are rendered before it begins to display content. Otherwise, the new rules that the style sheets will present may disrupt the current look.

Remember: Every external style sheet must be downloaded from the network. The use of such network trips is extremely successful in minimizing the time the user has to wait for the page to load. Moreover, if this method was not used, the user would not see any content while waiting for the page to load, and therefore the bounce rate would be at risk of increasing.

Removing an unused CSS also prevents the creation of an unnecessary render tree. For those who ask what a render tree is, let’s quickly tell it: It’s kind of like a DOM tree, but with a small difference. The render tree contains a separate style for each node.

Detecting Unused CSS

You can use The Coverage tab of Chrome DevTools for that: 

Remove unused CSS

Google Lighthouse finds and flags the content you offer with the older image format by scanning. These photos shown in the Opportunities section are listed with their current sizes. The space savings you can achieve if you use an advantageous next-gen format are also offered in KB. Here is an example:

Use Next-Gen Formats Serving the Images

So why should you use the WebP format?

When you use JPEG 2000, JPEG XR, and WebP formats, you have the chance to compress images at the maximum rate. Moreover, the system that does this does not impair the image quality in any way. This means consuming less cellular data for the end-user. We can say that these formats, which are especially supported in Opera and Chrome, are the primary formats for images on the web. Compression with very low or complete loss is only possible with these.

How does saving calculation is done By Lighthouse? 

Google Lighthouse collects BMP, JPEG, and PNG images and converts them while calculating potential savings. WebP format compares sizes with others and finds the value.

The Using Preconnect warning that Google Lighthouse provides to the user as a result of the audit is as follows:

Screpy using Preconnect

It should be noted that: We have stated that you should use <link rel= preconnect> in order for the system to run smoother and to increase performance. This code is supported by almost all browsers, thus strengthening the responsible view.

Improving page load speed: Using preconnect

  • You can use options such as preconnect or dns-prefetch to increase the page load speed on your web page. These create an early connection system especially for connections to third-party organizations and speed up the loading of your page.
  • <link rel="preconnect"> is another recommended tool to use. When you use this code, you are informing your browser about a connection request found on your page. That is, the connection request to be made with another origin on your page has been notified to the browser beforehand. In this way, the browser is getting ready for this. This increases the loading speed.

Remember, the connections you use on your web page can cause slow networks. You will have to sacrifice more time, especially if you want to use a secure connection.

If all this happens while your page is loading, it will harm the experience of the end user. In order to prevent this situation that results in an increase in bandwidth, you can use the codes mentioned in detail above. In this way, you can reduce the time spent by waiting instead of exchanging data.

In short, what you do with these actions is to inform the browser of your intention in advance:

<link rel="preconnect" href="https://example.com">

Informing the browser about your page’s intent

Informing your browser about intention will let your browser know that you will link to the page in question and that you plan to retrieve from there.

Preconnect or Preload? 

Remember, using <link rel="preconnect"> is a good solution, but not perfect. It can still be extremely time-consuming in terms of CPU, especially when it comes to secure connections.

To get a performance tweak, you should try using <link rel= "preload"> instead of preconnect link. In this way, you will have experienced a more comprehensive performance improvement process.

The Google Lighthouse system recommends using video formats where the content on your web page is automatically animated (GIFs). In this way, the loading performance of your web page increases, and certain KBs are saved. Lighthouse states in its report the size of the existing file and how much potential savings will be made to modify this file.

Video Formats for Animated Content

Why So? – Transforming GIFs into Video Formats 

We can say that large gifs are not a very effective tool for delivering animated content to the end user. So converting gifs to video format would mean saving in bandwidth. The formats you can use will be MPEG4 / WebM for animations. If we are talking about a static image, you can use PNG / WebP.

How to pass the audit?- Creating MPEG videos

You can use FFmpeg to convert gifs to video. The command you need to run to get video format using this tool is:

ffmpeg -i my-animation.gif my-animation.mp4

What this command does is this: It tells FFmpeg to accept my-animation.gif as an input. The system is flagged with the mentioned input -i. It then asks it to output this input as my-animation.mp4.

How to pass the audit?- Creating WebM videos

We can say that WebM videos are smaller in size than other MP4s, but one thing should be careful. Not all browsers support WebM.

Run the following command to convert your gif to Webm using FFmpeg:

ffmpeg -i my-animation.gif -c vp9 -b:v 0 -crf 41 my-animation.webm

How to pass the audit?- Replacing the GIF image with a video

There are three main features that force GIFs to be replaced with videos:

  1. Play automatically
  2. Continuously keep playing in a loop
  3. No audio files

To change these, you can recreate the file with these codes: 

<video autoplay loop muted playsinline>
   <source src="my-animation.webm" type="video/webm">                        
   <source src="my-animation.mp4" type="video/mp4">
</video>

When Google Lighthouse encounters too many redirects, it issues a warning like:

Too Many Page Redirects

If there are two or more redirects on a page, this page automatically drops audits.

How to pass the page redirects audit? – Eliminating redirects

It will be sufficient to remove the redirect links to external resources that are too many in flagged pages. Remember, you must specifically avoid such redirect processing on resources required for the Critical Rendering Path. Also, it is extremely important to make sure that your page is mobile responsive, especially in this type of error.

Google Lighthouse performs measurement in kibibytes to calculate the payload on your page. In this way, a realistic figure is obtained by taking into account all the resources requested by your page. The request, which has the highest rate of payload, is at the top of the list and sorting occurs hierarchically. Check out the example below:

Enormous Network Payloads

When examined in general, it is possible to say that the average network load that should be between 1700 and 1900 KiB according to HTTP archives. Determining peak loads can be crucial to understanding where to start for load elimination. It is useful to optimize by briefly taking a look at the pages that Lighthouse cannot flag, which has marked the pages with more than 5000 network requests.

How to pass the audit? – Reducing payload size

Payload should be increased to you to increase the user experience and strengthen your web page. For this, you can choose the following methods:

  1. Do not run requests until it’s needed. It may be helpful to use the PRPL method.
  2. Optimize to ensure that requests have a small workload. For this, you can compress the network by shrinking it, and you can choose to use WebP in image files (instead of JPEG or PNG). Also, you can reduce the compression level of JPEG images to 85.
  3. In addition, you can prevent reloading from the source every time by performing a cache record. With Cache, your browser quickly displays data from previous experiences, rather than retrieving location data from the source each time. This means much faster loading. All of these can be listed as factors that increase speed.
  4. See the other articles about web loading speed for more. 

Google Lighthouse sends you a warning about the 3rd level request coming to the critical request chain. These requests are generally marked as preload candidates. Here is a screenshot of the warning:

Preload Key Request

How does Lighthouse manage the audit?

The critical request chain on your web page will look like the following:

index.html
|--app.js
   |--styles.css
   |--ui.js

Let’s briefly examine the example above. You can see <script src="app.js"> in the index.html file above. When app.js starts running in this type of code, that system calls fetch() command. The reason it does this is to download styles.css and ui.js. In this case, your page will wait for these two resources to be downloaded and will not be visible until this process occurs, which will negatively affect its performance. Passing and executing processes must also be completed before your page to appear. In such a case, Google Lighthouse defines styles.css and ui.js as candidates and flags them to be preload candidates.

In order for your page to perform well, you need to save time. The performance will also vary, depending on how early the browser can initiate its own connection requests after the preload links are declared. To give an example from the code snippet above, let’s assume that it takes 200ms for app.js to download, parse, execute. In this case, the potential savings for each would be at most 200ms.

In short, you can make your page load faster thanks to the preloading request. See screenshot below:

Preload Key Request

Actually, the problem here is: the only way for the browser to be aware of the last 2 sources is to download, parse, and execute app.js. waiting for these does not provide the desired performance. Because these resources are extremely important and they must be downloaded as quickly as possible.

If you want your page to run faster, you have to make sure your browser downloads essential resources as quickly as possible. In order to do this, it would be a good solution to inform the browser about the key resources in your HTML source code.

<head>
  ...
  <link rel="preload" href="styles.css" as="style">
  <link rel="preload" href="ui.js" as="script">
  ...
</head>
Preload Key Request

 If you want to lower the Time to First Byte, you need to understand what causes its performance to drop. Statistical data often described as “failed” are results where the TTFB is longer than 600 ms. Users’ experience drops when the page takes a long time to load. A slow loading speed increases users’ bounce rate.

How Does Process Work? – And why does experience too long TTFB happen? 

The process works as follows:

  1. Users navigate to a URL in the web world.
  2. The browser generates a network request to retrieve the content at this URL.
  3. Your server sees the request and allows it.
  4. The page content is presented to the user.

This actually means doing a lot of work at once. In order to do this, the server must be optimized.

How to pass the audit? – How to minimize TTFN to under 600 ms? 

If you want to reduce the time to first byte duration to less than 600ms, there are lots of things you can do.

  1. First of all, you need to determine how many different conceptual works the server should do together in order to return the page content at the right time.
  2. You also need to measure how much time is needed for each of the tasks that need to be done.
  3. Start with the longest-running tasks to optimize. Even the shortening of long-running tasks at a certain rate will give you a high rate advantage in terms of total speed.

Performing Improvement… Tips and Tricks!

We offer you a few tricks to perform improvement:

  1. First of all, the application logic of the servers may need to be optimized. For example, if you are using a server framework, you can make changes by looking at the suggestions that the framework offers.
  2. The way the server queries the databases may negatively affect the page speed. You can solve this problem more easily if you switch to faster database systems.
  3. You may need to increase the power and quality of your server hardware to have more memory fields. In this case, your performance will also increase.

When you use one or more of the above tricks, you will see an improvement in page speed as long as the problems that will provide particularly high-score improvements are solved. The improvement in page speed allows you to pass this audit and can contribute to SEO by increasing the user experience. Check out our other related audit topics for more information!

If static resources in the web page cannot perform this caching, in other words, if they are not cached, Google Lighthouse scans and flags them. Like in the image below:

Efficient Cache Policy with Static Assets

In order for the Lighthouse system to accept a page as cacheable, several different conditions must be met. The following conditions must all be met at the same time:

  1. The resource must be in one of the formats such as font, image, media file, script, or stylesheet.
  2. The resource must have an HTTP status code of 200, 203, or 206.
  3. The resource must not have a no-cache policy. Because if such a situation occurs, the necessary conditions cannot be met.

The Google Lighthouse system tells you that an audit has failed and the page in question needs to be fixed, using 3 columns:

  1. URL: The URL associated with the cacheable resource search is given to the user. In this way, the user easily navigates to the area in question.
  2. Cache TTL: The user gets detailed information about the cache duration on the page in question.
  3. Size: Size of data saved by users is written. 

How to pass the audit? – Caching static resources using HTTP caching

You need to make your server return the Cache-Control HTTP response header. Here is an example:

Cache-Control: max-age=31536000

The max-age value you see above means: How long should the browser cache the resource in question? This value is the calculated version of this time in seconds. Generally, the value 31536000 is preferred for this. This number of seconds is the number of seconds in a year (24 (hours) x 365 (days)).

If the basic properties of the resource change, mean that the user changes his or her browsing habits, you can use no-cache to cancel the previously saved cache data. In this case, although the browser continues to cache the file marked as no-cache, the control through the server cancels it.

Important Tip: Remember, high cache duration does not always provide the best result. This may prevent necessary improvements in website navigation. Therefore, determining the cache time according to your visitor profile is something you have to do.

There are different methods of caching and they also need to be customized. You can also browse our other related content.

Using Chrome DevTools to verify cached responses

If you want to check what is in the cache files, use Chrome DevTools and open the Network tab from there.

  1. You can then open DevTool by pressing Control + Shift + J (or Command + Option + J on Mac).
  2. Click on the Network tab.

For example, below you see a report about size in the relevant column in Chrome DevTools.

Efficient Cache Policy with Static Assets

Chrome pulls the most requested results in memory cache to provide fast service. When the browser is closed, it deletes this data. To examine whether a resource has the cache-control head properly, the HTTP header data must be checked:

  1. Click on the URL of the relevant page. This URL is located under the name in the Request table.
  2. Then click on the tab that says Headers.
Efficient Cache Policy with Static Assets cache control

Google Lighthouse finds and flags pages that have elements that search engines cannot index. The system alert that does this is as follows:

  • It’s also worth noting that Lighthouse only checks headlines and items that cause problems in all search engines. For example, sometimes a <meta> element may also cause problems with indexing. Here is an example:
<meta name="robots" content="noindex"/>

Here is a HTTP response header example that block indexing: 

X-Robots-Tag: noindex

Moreover, the page may have additional <meta> elements that prevent indexing: 

<meta name="AdsBot-Google" content="noindex"/>

Lighthouse does not include such items that cause problems in specific browsers in the audit. However, this does not change the fact that these items are problematic. That’s why it’s very important that you fix these as well.

How to pass the audit? – Ensuring that search engines crawl your page

A little note: You may not want every page to be indexed. For example, sitemaps or legal content in general, that is, the pages that the user does not need to see, are not desired to be indexed. But don’t worry, even if a page isn’t indexed, it’s possible to go directly to that page if the user knows the URL. This prevents user experience and SEO from being negatively affected.

To avoid the problem with the pages you want indexed, you need to remove the following items:

  • If you are setting up the HTTP response header, the HTTP response header in the source should be deleted:
X-Robots-Tag: noindex

The meta tag in the heading part of the page should be removed:

<meta name="robots" content="noindex">

If there is a meta tag that blocks a specific crawler and it is in the page heading, it should be removed:

<meta name="Googlebot" content="noindex">

What about an additional control? 

If you want to perform additional checks on the indexing of your pages and you want to create different systems for different pages by seeing what search engines pay attention to in the indexing process, you can take a look at the guides below.

  1. Google Search
  2. Bing 
  3. Yandex

Google Lighthouse flags the pages that do not have the necessary font size (font size smaller than 12 px): 

The Font Size in the Document is not Legible

In Lighthouse’s audit, if more than 60 percent of a page is smaller than 12px, the page is marked. If the ratio is not that high, the audit is passed. But we still recommend that you check and optimize this page.

On the result page, you are presented with the source, selector, percentage size of the problem in text and font. You are expected to analyze the problem based on these variables.

How to pass the audit? – Fixing eligible fonts 

Check font sizes via CSS. If the error in the Lighthouse report says ” Text is illegible because of a missing viewport config ”, what you need to do is adding between the <head> tag of the document ” <meta name = "viewport" content = "width = device-width, initial-scale = 1 is to add ``> ”.