

Core Web Vitals are Google’s user-experience metrics for how fast a page feels, how quickly it responds, and how stable the layout stays. They boil down to three signals: LCP (when the main content finishes loading), INP (how long interactions take to show a visual response), and CLS (unexpected layout shifts). Because Google uses real-user data to judge these, slow images, heavy JavaScript, and late-loading fonts or ads can drag scores down even when a site looks fine on your machine. The surprise is how often the fix is simply removing third-party bloat and reserving space for elements, not chasing a perfect lab score.
Core Web Vitals explained and how Google assesses them
Page Experience signals vs Core Web Vitals
Google recommends “good” Core Web Vitals targets of LCP at or below 2.5 seconds, INP at or below 200 milliseconds, and CLS at or below 0.1, evaluated at the 75th percentile. See the official threshold methodology.
Page Experience is broader. It’s best to think of Core Web Vitals as one important part of the overall “is this page pleasant to use?” picture. In Google’s own framing, there is no single page experience signal. Instead, Google’s core ranking systems consider multiple signals that align with page experience, and Core Web Vitals are one of the inputs.
Practically, Google assesses Core Web Vitals using user-centered, field-style measurements (not just a one-time lab test). The common yardstick for “good for most users” is meeting the recommended threshold at the 75th percentile, split across mobile and desktop. That’s why a page can feel fast for you, yet still miss CWV if a meaningful slice of users are on slower devices or networks.
It’s also worth keeping expectations realistic. Strong Core Web Vitals can help in competitive search results where many pages are similarly relevant, but they do not override relevance or content quality. Focusing on overall usability (clear main content, fewer interruptions, mobile-friendly layouts, secure delivery) usually aligns better with rankings than chasing “perfect” scores.
For Google’s definitions and the latest guidance, see Page Experience and the Web Vitals overview.
Why Core Web Vitals matter for SEO and user experience
Ranking impact: baseline signal vs differentiator
Core Web Vitals are not a shortcut to rankings. Google’s systems still prioritize relevance, intent match, and overall quality. But Core Web Vitals can act as a baseline quality filter: if two pages are similarly helpful, the page that’s noticeably faster to load, responds more quickly, and stays visually stable is more likely to perform better over time.
In practice, Core Web Vitals tend to matter most in competitive SERPs where many results are “good enough” on content. That’s when page experience becomes a differentiator. It’s also why teams often see bigger SEO gains from moving pages from “poor” to “good” than from chasing marginal improvements after they already pass. Google summarizes this relationship in its guidance on Core Web Vitals and Google Search results.
Core Web Vitals also fit the AI era of search. As AI answers and summaries reduce low-intent clicks, the clicks you do earn are more valuable. A slow or jumpy landing page turns that hard-won visit into an immediate back button, which can limit the upside of even the best content.
Business outcomes beyond rankings
Even when rankings don’t change, Core Web Vitals improvements often pay off in user behavior and revenue metrics:
- Higher conversion rates on key flows (signup, lead forms, checkout) when pages feel responsive and predictable.
- Lower bounce and abandonment, especially on mobile where networks and devices vary widely.
- Better engagement with content when the layout doesn’t shift and interactions feel instant.
- Fewer support issues tied to misclicks, broken UI states, and “the page froze” complaints, which are common symptoms of poor INP.
The simplest way to treat Core Web Vitals is as performance budgeting for user trust: keep the main content fast, keep interactions snappy, and avoid surprises in layout.
Core Web Vitals metrics: LCP, INP, and CLS
Largest Contentful Paint (LCP) meaning and examples
Largest Contentful Paint (LCP) measures when the main content of a page becomes visible. Specifically, it captures the render time of the largest image or text block in the viewport during load, which is why it maps well to “does this page feel like it’s actually here yet?”
Common real-world LCP examples include:
- A homepage hero image or banner
- A featured product image on an ecommerce category page
- A large H1 headline or opening paragraph on a blog post (this happens more often than people expect)
If your LCP element is text, the bottleneck is often render-blocking CSS, delayed font rendering, or heavy JavaScript that prevents the browser from painting quickly.
Interaction to Next Paint (INP) meaning and examples
Interaction to Next Paint (INP) measures responsiveness: how long it takes from a user action to the next visual update. It looks across interactions on the page and reports a single value that represents overall interaction latency, with outliers handled so it reflects what most users experience.
Good INP is about the flows that matter to your business, for example:
- Tapping “Add to cart” and seeing the cart update
- Opening a mobile menu or search overlay
- Using filters, sort, or pagination on a category page
INP focuses on clicks, taps, and key presses, not scrolling or hovering. In 2026, a frequent INP trap is “helpful” extras that run on the main thread, like analytics stacks, tag managers, A/B testing, personalization, and AI chat widgets.
Cumulative Layout Shift (CLS) meaning and examples
Cumulative Layout Shift (CLS) measures visual stability, meaning how much visible content moves around unexpectedly. The score is based on how much of the viewport shifts and how far it shifts.
CLS problems usually show up as:
- Images, ads, or embeds loading without reserved space
- Cookie banners or promo bars pushing content down after the user starts reading
- Font swaps that change text size and reflow the page
Layout shifts closely tied to recent user input can be excluded from CLS when they occur within the metric’s interaction window. See the current CLS documentation for the exact rules and exceptions.
What happened to First Input Delay (FID)
First Input Delay (FID) was the older responsiveness metric, but it only measured the delay on the first interaction. INP became the Core Web Vitals responsiveness metric, and Google confirmed that INP replaced FID on March 12, 2024.
Core Web Vitals scoring thresholds and what “good” means
Passing criteria and the 75th percentile
Core Web Vitals are scored in three buckets: Good, Needs improvement, and Poor. The widely used “good” thresholds are:
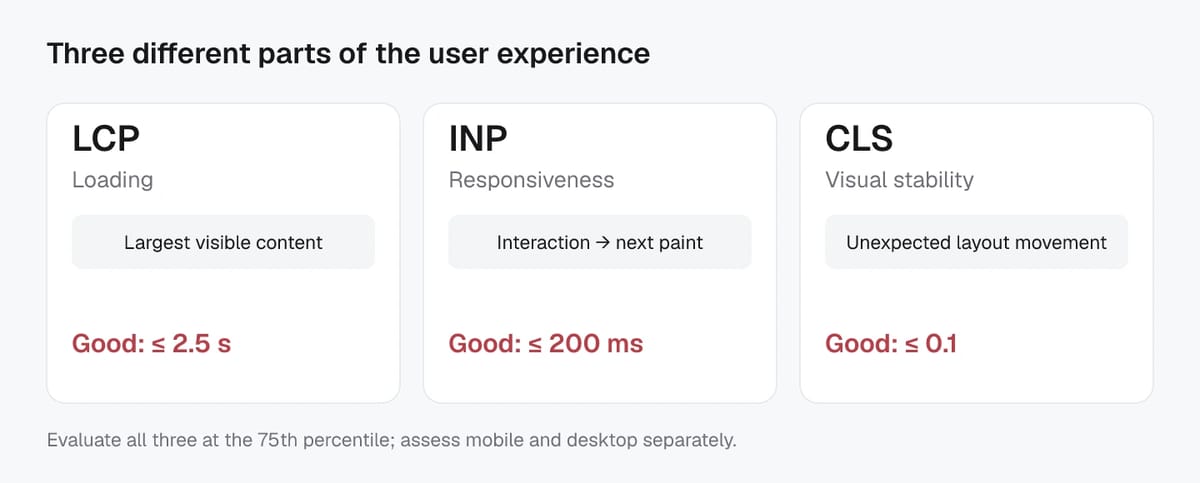
- LCP: 2.5 seconds or less (needs improvement: 2.5–4.0 seconds; poor: over 4.0 seconds) - INP: 200 milliseconds or less (needs improvement: 200–500 milliseconds; poor: over 500 milliseconds) - CLS: 0.1 or less (needs improvement: 0.1–0.25; poor: over 0.25). These are the current web.dev thresholds.
The part many teams miss is what “passing” actually means. Google’s reporting is based on real-user performance, and the evaluation is typically anchored to the 75th percentile (p75). In other words, it’s not enough for your page to be fast for average users. It needs to be good for most users, including people on slower phones, weaker networks, or busy CPUs. Google’s Web Vitals team explains the rationale behind these thresholds and the p75 approach in its guide on defining Core Web Vitals thresholds.
Operationally, “pass Core Web Vitals” usually means your p75 is in the Good range for all three metrics, not just one. If INP is great but LCP is poor, the overall experience is still considered weak.
Mobile vs desktop evaluation differences
Google evaluates Core Web Vitals separately for mobile and desktop, and Search Console splits reporting the same way. Each view reflects a rolling window of field data and shows p75 values for the selected device category. The Core Web Vitals report in Search Console also groups similar URLs, since templates often share the same performance issues.
The thresholds are the same on both devices, but outcomes differ. Mobile scores are often worse because of slower CPUs, variable networks, and heavier competition for the main thread (especially when third-party scripts or interactive UI elements are involved). Since Google’s indexing and ranking systems predominantly use the mobile version of content, mobile performance is the safer place to prioritize first.
How to measure Core Web Vitals with the right data
Field data vs lab data differences
To measure Core Web Vitals correctly, you need to separate field data from lab data.
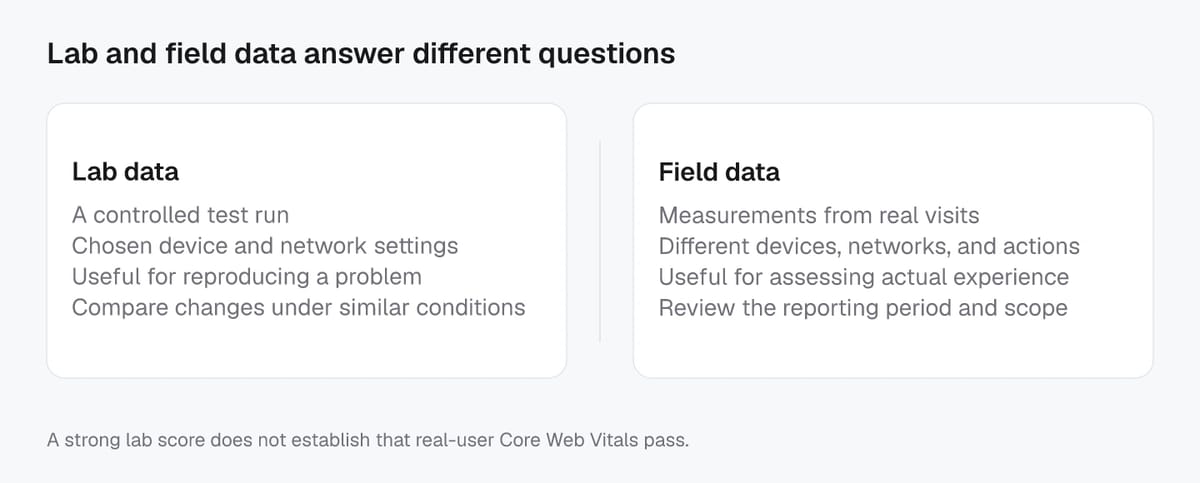
Field data (also called real-user monitoring) comes from real visits on real devices and networks. It reflects what most users experience over time, including slower phones, third-party scripts, and interaction patterns. This is the data Google’s Core Web Vitals reporting is built around.
Lab data is a controlled test run in a simulated environment. It’s invaluable for debugging because you can reproduce problems and see what changed after a deploy. But it can miss issues that only happen to some users, such as long main-thread tasks on mid-range Android devices, layout shifts triggered by late-loading ads, or interaction delays caused by tag manager bloat.
Tools that report Core Web Vitals (Search Console, PSI, CrUX)
Google Search Console is the most SEO-centric view. The Core Web Vitals report groups similar URLs and shows whether those groups pass based on field data over a rolling window, which makes it easier to prioritize template-level fixes. The official documentation is in the Core Web Vitals report help page.
PageSpeed Insights (PSI) is useful for quick checks. It typically combines field data (when available for the URL or origin) with a Lighthouse lab run, so you can see both “how users experienced it” and “what to fix next.”
Chrome UX Report (CrUX) is the underlying dataset you can query directly to validate trends, compare templates, or power your own dashboards. The CrUX API documentation explains how URL-level and origin-level queries work and how the data is aggregated.
Why a great Lighthouse score can still fail CWV
A Lighthouse score can look excellent while Core Web Vitals fail because Lighthouse is a single synthetic run. It can’t fully represent real traffic mixes, device constraints, or long-tail interaction delays that push your 75th percentile into “needs improvement.”
Also, Lighthouse performance scoring includes metrics that are not Core Web Vitals (for example, Total Blocking Time). You can “score well” in the lab while still having real-user INP problems caused by heavy JavaScript, third-party tags, or interactive widgets that only load for certain segments.
Improving Core Web Vitals: common causes and practical fixes
Turn the metric into a page-level diagnosis before changing code. The page speed optimization checklist provides a measure → inspect → fix → verify workflow; Screpy's Core Web Vitals monitoring can help follow lab-based results for selected URLs. Use field data when you need to assess visitors' INP rather than treating lab TBT as the same metric.
Template-based prioritization: pages to fix first
Start with templates, not one-off URLs. Core Web Vitals failures usually come from shared layouts, shared scripts, and shared media patterns.
Prioritize in this order:
- High-traffic templates (homepage, category pages, top landing pages). Fixes here move the most real users.
- Revenue-critical flows (product detail, cart, checkout, lead forms). Even small INP and CLS improvements can reduce abandonment.
- Pages labeled “Poor” in bulk in your reporting. Moving “Poor” to “Good” is typically more impactful than polishing already-passing pages.
Within each template, look for a small number of repeatable changes you can roll out everywhere (image rules, font strategy, tag limits, layout reservations). That beats manual page-by-page tuning.
Common causes by metric (LCP, INP, CLS)
LCP (loading): Common causes are slow server response, render-blocking CSS/JS, and an unoptimized hero element. Practical fixes include prioritizing the hero image (correct size, modern format, CDN), reducing critical CSS, deferring non-critical scripts, and avoiding client-side rendering for above-the-fold content when possible.
INP (responsiveness): The usual culprit is too much JavaScript on the main thread (framework hydration, heavy UI libraries, third-party tags, A/B testing, analytics). Fix by trimming and splitting bundles, breaking up long tasks, moving expensive work off the main thread (where feasible), and loading non-essential features after user intent. AI chat widgets and personalization scripts are frequent INP regressors, so gate them behind interaction or load them in a way that does not block primary UI.
CLS (stability): Most CLS comes from missing size attributes or late-inserted elements. Always reserve space for images, ads, and embeds (width/height or aspect-ratio). Avoid injecting banners above content after load. Be cautious with web fonts so swaps do not reflow text unexpectedly.
Common causes by site type (ecommerce, content, JS-heavy)
Ecommerce sites often struggle with LCP on category and product pages (large images, carousels), and INP from filters, search, and tag-heavy marketing stacks. Keep faceted navigation UI lightweight and treat third-party scripts as a performance budget.
Content sites commonly fail CLS due to ads, embeds, and sticky headers that appear late. Reserve slots early and keep “below the fold” widgets from shifting the article body.
JS-heavy apps (SPAs, dashboard-like sites) typically fail INP from hydration and long tasks. Focus on route-level code splitting, partial hydration where your stack supports it, and ensuring core interactions stay responsive even while background work runs.