
Investigate an organic traffic trend
Start with clicks and impressions, then isolate the query, page, country, device, search type, and date pattern responsible for the visible movement.
- Sitewide trend
- Affected segment
- Page and query evidence

Connect your site's Search Console property to review Google clicks, impressions, CTR and average position. Investigate queries, pages and audience segments beside crawl evidence, with available keyword research and a path into Rank Tracker.
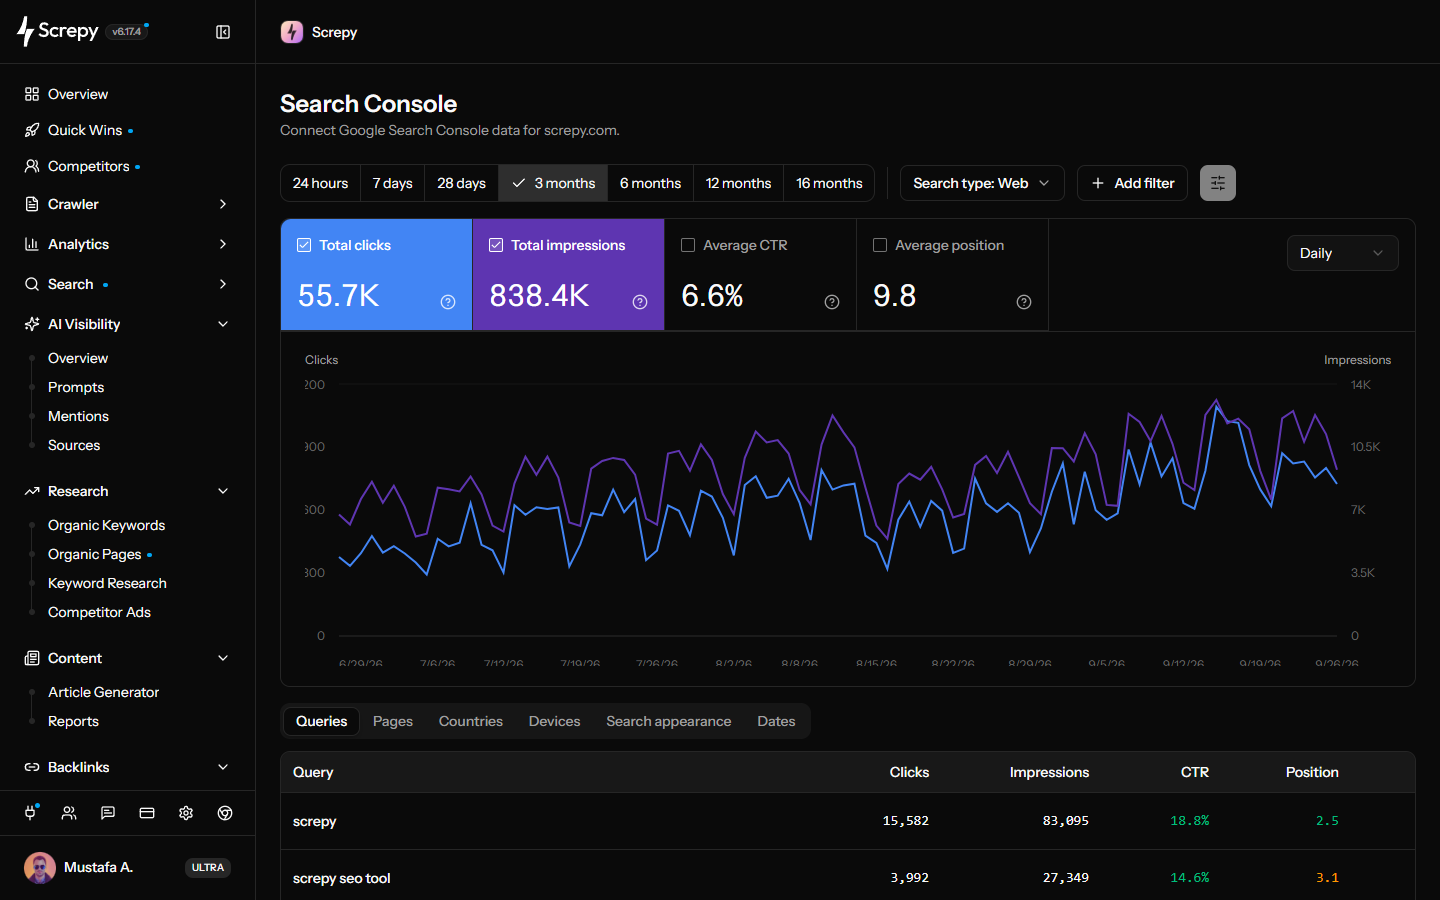









Bring your site's Google performance into its Screpy project. The project owner's connected Google account supplies access, so teammates can review the same property without connecting separate accounts.
 Screpy
See whether a change involves visibility, clicks or click-through rate before deciding what to investigate. Select the metric lines you want to see together on the chart.
Start with the three-month view, then choose a reporting window that fits the question. Read the timeline alongside date rows to locate the movement before examining its queries or pages.
Requests
1,860Separate branded searches, a content folder or a device audience without losing the reporting context. For example, combine a page containing /guides/ with Mobile to examine that folder's mobile performance.
Switch between the question's search surface and table breakdown. Google supplies different data for Web, Image, Video, News, Discover and Google News; an empty surface is not evidence of lost traffic everywhere.
Clicks186
Which searches reach a page, and which pages appear for a query? Open either relationship to investigate content fit or overlapping URLs, while keeping the detail window's independent scope in mind.
linen shirt/shop/linen186Clicks/guides/linen74ClicksThe main Queries table places available keyword research beside your actual Google performance. Use those signals to assess demand and intent without mistaking market estimates for the property's recorded results.
Search volume
2,400Use Search Console to choose an existing query worth monitoring, then open its prefilled Rank Tracker form. Scheduled checks answer a different question from Google's impression-based average position.
linen shirtUSAsk a connected AI assistant to query Google performance or compare periods with consistent scope. This comparison is available through SEO MCP; the dashboard itself does not show a side-by-side period report.
Explore connected Google Search Console data through SEO MCP. Compare periods, filter queries or pages and ask your AI assistant to explain changes in clicks, impressions and CTR.
Start with the correct property and reporting scope, narrow the movement to a useful segment, inspect its pages and queries, then use the right second source before assigning work.
The project owner authorizes a Google account with read-only Search Console access. Use the accessible property matching the project website, then confirm that it contains the expected data; permitted teammates share that connection.
Choose a supported date range and separate Web, Image, Video, News, Discover, or Google News data. Use the chart interval that makes the trend readable without hiding meaningful daily movement.
Narrow the report by query, page, country, or device. Use exact, contains, exclusion, or regular-expression filters where supported so sitewide averages do not obscure the affected segment.
Open a page's queries or a query's pages to investigate their relationship. These detail windows independently use last-month-to-today Web data and the first 50 returned rows, not the main report's selected filters. Keyword enrichment appears in the main Queries table.
Use Rank Tracker for selected-keyword SERP monitoring, Website Audit for crawl and on-page evidence, or Quick Wins for defined opportunity reports. Keep the original Search Console range as the baseline.
Clicks, impressions, CTR, and average position become more useful when the report is narrowed to the page, query, market, device, and Google surface behind the decision.
Start with clicks and impressions, then isolate the query, page, country, device, search type, and date pattern responsible for the visible movement.
Find queries and pages that already appear in Google but attract relatively few clicks, then inspect result intent and snippet fit before rewriting titles or descriptions.
Open a landing page's query details to check its search intent and content fit. This window uses last-month-to-today Web data, independently of the main report; review keyword research context in the main Queries table.
Compare the evidence inside focused country, device, and search-type segments instead of treating one blended average as the experience of every audience.
Screpy preserves the source context instead of presenting aggregated Search Console data as live rankings, complete query demand, or proof that one website change caused a result.
Google reports an average based on recorded impressions and the topmost result from the property or page. Use it as a trend signal rather than a guaranteed current SERP position.
The newest Search Console rows may still change, and reporting is not a real-time analytics feed. Avoid attributing a same-day movement to one release without enough complete data.
Google can omit anonymized or low-volume queries and apply reporting limits. A missing query does not prove that the search never produced visibility.
Property-level charts and page-grouped tables can count impressions, clicks, and position differently, while data is generally assigned to canonical URLs. Compare like with like.
Use Search Console for observed Google performance, Rank Tracker for scheduled checks of selected keywords, and Quick Wins for predefined opportunities built from connected evidence.
Inspect Google clicks, impressions, CTR, average position, dimensions, filters, and query-to-page relationships for the connected property.
Monitor selected keywords on a schedule with defined country, language, location, and device settings, independent of Search Console impressions.
Review focused search, content, crawl, and performance opportunities from the data sources available for one Screpy project.
Query and page evidence becomes more useful when it is connected to the planning, publishing, and release workflow that can act on it.
Use search evidence to prioritize existing pages, prepare campaigns, and explain progress to stakeholders.
Connect landing-page and documentation visibility with the releases that change those routes.
Screpy documentation
Follow the Screpy guide to connect Search Console, review search performance, and interpret queries, pages, and visibility changes.
Learn the concepts behind this workflow and apply them with practical SEO guidance.
Connect Google Search Console through MCP, run verifiable SEO analysis, and fix date, filter, pagination, and total mismatches using a real example.
Read articleAverage position in Google Search Console: interpret rankings by query and page, account for SERP features, and spot misleading averages vs clicks and CTR.
Read articleFind image-based search traffic in Google Search Console with the Web: multimodal filter. Learn what it shows, why it may be empty, and what to check next.
Read articleCTR drops in Google Search Console: compare periods, isolate affected queries/pages, check position, SERP features, snippets, and seasonality then fix titles.
Read articleLearn how Screpy uses connected Google Search Console data to support search analysis and SEO decisions.
Choose 24 hours, 7 days, 28 days, or 3, 6, 12 or 16 months, with three months as the default. The 24-hour preset requests yesterday and today as Pacific calendar dates and includes preliminary hourly data. Other windows use finalized data. The dashboard has no custom-date or side-by-side comparison view; SEO MCP supports custom periods and comparisons.
Search Console explains how a website performs in Google Search. Viewing that data beside crawls, audits, speed monitoring, and rankings makes it easier to connect search changes with specific pages and website work.
No. Search Console reports aggregated performance from real Google Search activity, while rank tracking follows selected keywords on a defined schedule, location, and device. The two sources answer different questions and work well together.
No. Search Console average position is an aggregated metric based on the topmost result recorded across impressions. Use it as a trend signal, and use Rank Tracker when you need scheduled checks for selected keywords, locations, and devices.
Screpy supports Web, Image, Video, News, Discover, and Google News search types. A type only returns rows when Google Search Console has matching data for the connected property and selected date range.
No. Google can report recent data as preliminary, withhold some queries for privacy, and apply reporting limits or aggregation rules. Screpy presents the data available for the authorized property rather than estimating missing Search Console rows.
Yes. Add up to four query, page, country or device rules, combined with AND. Supported operators include contains, exact match, exclusions and regular expressions. Search appearance is a table grouping, not a dashboard filter option.
You can review clicks, impressions, click-through rate, average position, queries, pages, countries, devices, search appearance, and date rows. Available history and dimensions depend on the performance data Google provides for the connected property and selected search type.