
Add traffic context to an SEO review
Compare site traffic with Search Console, ranking, crawl, and performance evidence for the same period without claiming that one movement caused the other.

Review recorded website visits, page views and audience trends beside your SEO work. Connect a matching Cloudflare zone to see what changed, then use the right evidence to investigate why.
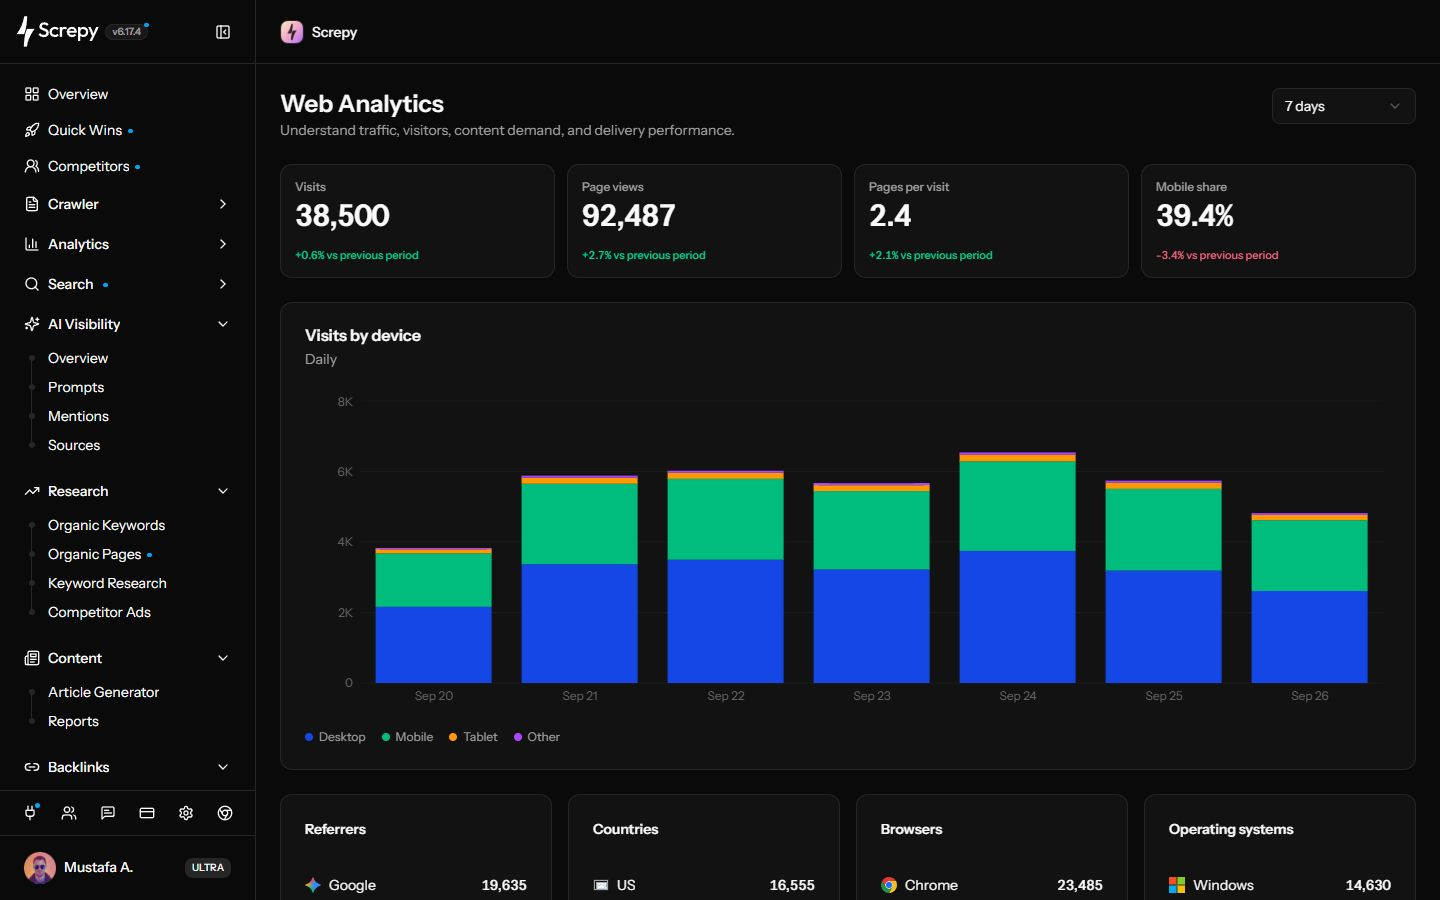










Bring recorded browser traffic into the same Screpy project as your SEO work. Connect your Cloudflare account, match the website zone and enable Web Analytics before interpreting the numbers.
 Screpy
Read the traffic cards as distinct measurements. A rise in page views does not automatically mean more people visited or completed a useful action.
Put a traffic change in a defined time window before connecting it to a release or SEO decision. Each card compares the selected interval with the immediately preceding interval of equal duration.
See whether a traffic movement is concentrated on desktop, mobile, tablet or other devices. The stacked chart shows visits per hour for 24 hours and per day for longer ranges.
Find the hosts behind the largest recorded referral counts. Use the list to choose a source to investigate after a partnership, mention or campaign.
Source
30example.org18
example.net12
See which countries contribute the most recorded visits. Use the country mix to choose a market for further research without confusing website activity with local search rankings.
Focus compatibility checks on the environments represented in current traffic. Browser and operating-system cards summarize separate dimensions of the same reporting interval.
Visits1,240
Ask about Quick Wins built from available search, crawl and connected Cloudflare traffic signals through SEO MCP. Cloudflare access covers those opportunities, not the complete analytics or bot-traffic dashboard.
Connect the matching zone, confirm Web Analytics collection and choose a consistent period. Read the totals, isolate the relevant device or audience pattern and verify the explanation in the tool that measures it.
Authorize the Cloudflare account that can access the website zone attached to the active Screpy project. Update the token when the zone or required permission is unavailable.
Enable Web Analytics when the project shows the setup control. Confirm that the website can collect browser reports; an enabled status alone does not prove data arrived.
Select 24 hours, 7 days, 30 days, 60 days, or 90 days based on the event or decision under review instead of comparing unrelated time windows.
Start with visits, page views, pages per visit, mobile share, and available previous-period changes so every device or audience observation stays tied to the same baseline.
Use device, referrer, country, browser, and operating-system patterns to narrow the question, then confirm search, campaign, release, availability, or page evidence in the tool that measures it.
The view is most useful when a defined SEO, release, referral, market, or compatibility question can be checked against one consistent reporting range.
Compare site traffic with Search Console, ranking, crawl, and performance evidence for the same period without claiming that one movement caused the other.
Use the visits-by-device chart and mobile share to see whether a total change is concentrated on desktop, mobile, tablet, or other traffic before testing the affected experience.
Check the leading referrers and countries after a partnership, campaign, launch, or localization change, then validate the specific source and landing experience outside the summary.
Use browser and operating-system visit counts to focus QA on the environments represented in current traffic while keeping compatibility conclusions tied to real tests.
Screpy provides a focused Cloudflare traffic summary beside SEO workflows. It does not turn aggregate traffic into query attribution, conversion analytics, or proof of causation.
Web Analytics does not report Google queries, impressions, CTR, average position, or query-to-page relationships. Use the connected Search Console workflow for those questions.
Screpy does not currently show popular pages, custom events, goals, funnels, session recordings, or campaign attribution in this view.
Referrer, country, browser, and operating-system cards show up to five leading rows by visits. They are not complete visitor, session, or user-level datasets.
A change can reflect demand, referrals, campaigns, seasonality, releases, outages, or measurement conditions. Confirm the explanation with the source data relevant to the decision.
Use Web Analytics for broader site traffic, Search Console for observed Google search performance, or AI and Bot Traffic for verified crawler requests to website URLs.
Review visits, page views, pages per visit, mobile share, device trends, and leading audience breakdowns for the connected zone.
Inspect Google queries, pages, clicks, impressions, CTR, average position, and supported search dimensions for the connected property.
Review verified crawler categories, request trends, transfer volume, response outcomes, and non-2xx paths for the matching zone.
Learn the concepts behind this workflow and apply them with practical SEO guidance.
AI referral traffic in GA4 is easier to measure with session-source filters, regex channel groups, landing-page reports, and conversion checks for key AI assistants.
Read articleGA4 reports for SEO performance: filter organic traffic, compare landing pages, engagement and key events, and tie Search Console queries to conversions.
Read articleUnderstand whether your website traffic is healthy by tracking quality metrics, traffic sources, user behavior, conversions, and growth opportunities.
Read articleAI search traffic may convert at a higher rate than organic visits, but limited volume and attribution gaps mean GA4 data should guide practical channel decisions.
Read articleUnderstand the connected data source, metrics, reporting ranges, breakdown limits, setup requirements, and the difference between traffic and search-performance analysis.
Choose 24 hours, 7, 30, 60 or 90 days. The 24-hour view uses completed UTC hours; longer views use daily buckets and include the current partial UTC day. Available data depends on collection and source access, not just the selected range.
Connect your own Cloudflare account with a valid token and access to the matching zone. Enable automatic Web Analytics and confirm eligible proxied pages collect browser reports. Screpy distinguishes missing connection, unmatched zone, token updates, status failures and disabled collection.
Screpy compares the selected interval with the immediately preceding interval of equal actual duration. Relative change is (current minus previous) divided by previous, multiplied by 100. A zero previous value suppresses the comparison. Mobile-share change also uses relative percent, not percentage points.
The connected Cloudflare Web Analytics site supplies browser page-load reports, with classified bots excluded. Collection can miss blocked or undelivered reports and can include subdomains of the matched zone; it is not a complete server-request log.
No. Search Console reports Google queries, impressions, clicks, CTR, average position, pages, and other search dimensions. Web Analytics reports broader site traffic and audience breakdowns. Use both when investigating whether search visibility and site activity moved together.
No. Demand, referrals, campaigns, seasonality, releases, outages and collection changes can affect traffic. Compare the same periods and verify the proposed cause with search, campaign or product evidence.
The visits chart separates desktop, mobile, tablet, and other device traffic. Mobile share reports mobile visits as a percentage of all recorded visits in the selected range.
No. SEO MCP can return supported traffic-based Quick Wins for an accessible project with the required connection and data. It does not expose these metric cards, the device chart or the complete audience breakdowns. Review those in the Web Analytics dashboard.
You can review visits, page views, pages per visit, mobile share, previous-period changes, visits by device, and the five leading referrers, countries, browsers, and operating systems for the selected range.
Each card shows up to five categories ranked by visits. Blank referrer hosts and country codes are omitted, so the referrer list excludes direct or unknown sources. Browser and OS names may be Unknown. These are separate summaries, without combined filters or complete visitor records.
A visit is a recorded entry from a different website or a direct link, not a unique person. Page views are recorded page loads. Pages per visit is their ratio, rounded to two decimals; no visits leaves that ratio unavailable. It is not measured engagement time or a conversion rate.
Not currently. The page does not include a popular-pages table, conversion goals, custom events, funnels, session recordings, or campaign attribution. Use the analytics system responsible for those measurements when the decision depends on them.