

Render-blocking resources are usually CSS files and synchronous scripts in the head that force the browser to pause before it can paint anything meaningful. Start by finding which requests sit on the critical rendering path in Lighthouse or PageSpeed Insights, then separate what’s needed for above-the-fold layout from everything else. Inline a small slice of critical CSS, load remaining styles with media or preload techniques, and add defer (or async where safe) to non-essential JavaScript, especially third-party tags. One common trap is “fixing” the warning while delaying code that controls initial layout or fonts, which can trade a faster first paint for a jumpy page.
What “render-blocking resources” means in PageSpeed Insights
Blocking CSS vs blocking JavaScript
In PageSpeed Insights, a “render-blocking resource” is usually an external CSS file or a JavaScript file that the browser must download and process before it can paint the page. You’ll still see the concept even if the UI wording changes, because it’s rooted in how browsers build the DOM and CSSOM and then create the render tree.
Blocking CSS is the classic case. If a stylesheet is needed for the initial render (especially one linked in the <head>), the browser often waits for it so it can avoid painting unstyled or incorrectly styled content.
Blocking JavaScript typically happens when scripts are loaded in a way that pauses HTML parsing (for example, a synchronous <script> in the head). Scripts can also indirectly block rendering by delaying DOM construction or by forcing the browser to wait on CSS before the script can safely run. Lighthouse surfaces this as render-blocking requests in its performance insights, because it commonly delays the first visible paint. You can see how the audit defines and detects these requests in Google’s Lighthouse render-blocking requests guidance.
Which metrics get impacted (FCP and LCP)
Render-blocking resources most visibly impact:
- FCP (First Contentful Paint): If CSS or synchronous JavaScript sits on the critical path, the browser cannot paint meaningful content quickly, so FCP moves later.
- LCP (Largest Contentful Paint): Even if the LCP image or text downloads early, it might not be eligible to render until required CSS is ready, pushing LCP later. This is why trimming render-blocking CSS often improves LCP more than people expect, especially on mobile. The mechanics are explained well in web.dev’s LCP guidance.
Finding the CSS and JS files that block first paint
Using Lighthouse or PageSpeed Insights audit output
Start with a clean lab run so you’re not guessing. In PageSpeed Insights, look for the “eliminate render-blocking resources” style recommendation and expand it to see the exact URLs being flagged. Pay attention to:
- Resource type: CSS vs JavaScript, and whether it’s first-party or third-party.
- Where it’s used: theme/global stylesheet, framework bundle, tag manager, widget, A/B testing, chat, etc.
- Scope: files referenced early in the document (often in the
<head>) are more likely to delay first paint.
Treat the “estimated savings” as a prioritization hint, not a promise. Lighthouse is modeling a throttled device/network, so your real bottleneck might be different on a fast desktop vs a mid-range phone. If you need a quick refresher on what PageSpeed Insights is showing (lab vs field), the PageSpeed Insights documentation is worth skimming.
Confirming in Chrome DevTools Network and Coverage
Next, validate the report in Chrome DevTools so you can see what’s truly on the critical path.
In the Network panel, reload with DevTools open, check Disable cache, and consider Preserve log if you navigate during startup. Filter by CSS and JS, then look at the waterfall for requests that begin early and finish late. The big signals are: “requested from the document,” high transfer size, and long download plus processing time before any visible content appears.
Then open the Coverage panel and reload to measure used vs unused bytes per CSS/JS file. This is a fast way to spot a “blocking” stylesheet that is 90% unused above the fold, or a JavaScript bundle that ships far more code than the page needs. Chrome’s steps and controls are laid out in the Coverage panel guide.
Picking what must load first vs what can wait
Identifying above-the-fold critical CSS
“Critical CSS” is the smallest set of styles required to render the above-the-fold content in a stable, readable way. The goal is not perfect styling. It’s a first paint that looks correct enough and does not jump around.
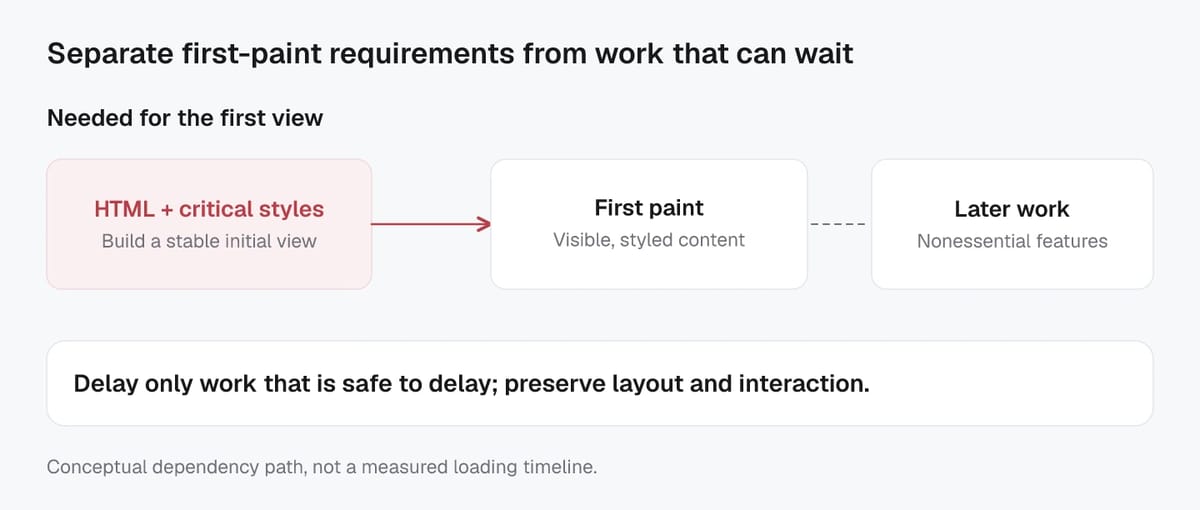
As a practical rule, critical CSS usually includes:
- Layout and structure: header, hero, primary navigation, grid/container rules.
- Typography basics: font size/line-height, base colors, and fallbacks so text is readable immediately.
- LCP element styling: the hero image container or headline block, including sizing so the browser can reserve space.
- Visibility rules: anything that would otherwise hide core content (for example,
display:nonetoggles that get reversed later).
Try to avoid pulling interactive states, deep components, and long-tail pages into your critical CSS. If you inline too much, you trade render-blocking downloads for a heavy HTML document, which can slow down initial parsing and TTFB-to-paint on mobile.
Auditing unused CSS and unused JavaScript
Once you’ve separated “must load first” from “can wait,” verify you are not shipping dead weight.
For unused CSS, prioritize:
- Large global stylesheets that are reused everywhere but only partially needed on most pages.
- CSS from UI kits or legacy themes that still load even after redesigns.
- Multiple font/icon packs when only a few glyphs are used.
For unused JavaScript, look for:
- One mega bundle that includes code for routes or features not present on the page.
- Libraries loaded for a single small effect.
- Third-party tags that initialize on every page even when the widget is not shown.
The best wins typically come from removing unused code, not just delaying it. This improves perceived speed for users and reduces the work browsers (and AI-driven search experiences that rely on fast rendering) need to do to understand the page quickly.
Fixing render-blocking CSS without breaking layout
Inlining critical CSS and loading the rest later
The safest way to remove render-blocking CSS is to inline a small critical CSS slice for above-the-fold content, then load the full stylesheet afterward. This keeps the first paint fast while preserving the full design once the non-critical CSS arrives.
Keep your critical CSS tight. Focus on layout, typography defaults, and the LCP element’s styling so the page can render in a stable state. Put it in a <style> block in the <head>, then load the main stylesheet normally (or via preload, covered next). If your inline CSS grows too large, it can slow HTML parsing and reduce the benefit.
A good sanity check: if removing the full stylesheet briefly makes the top of the page readable and correctly spaced using only your critical CSS, you are close.
Preloading stylesheets with onload swap
When you want the full CSS to start downloading early without blocking render, a common pattern is preload + onload swap. It tells the browser to fetch the CSS with high priority, then apply it after it loads:
<link rel="preload" href="/assets/app.css" as="style"
 onload="this.onload=null;this.rel='stylesheet'">
<noscript><link rel="stylesheet" href="/assets/app.css"></noscript>
This approach is widely documented and tends to be more predictable than older hacks. For details on how preload works, see MDN’s rel="preload", and for how Lighthouse thinks about blocking stylesheets, see the Chrome team’s guidance on render-blocking resources.
Avoiding FOUC and layout shifts after CSS changes
The main risk of “unblocking” CSS is FOUC (flash of unstyled content) or new layout shifts. You can reduce both by:
- Ensuring critical CSS includes sizing for above-the-fold components (especially the LCP block).
- Avoiding late-loading CSS that changes font sizes, line heights, or spacing for visible elements.
- Testing on slow throttling in DevTools. Watch for elements jumping when the full stylesheet applies.
For SEO, this is not just about scores. A stable, readable first paint helps users, and it also helps modern search and AI-driven systems extract meaning from the page without waiting for heavy styling to settle.
Fixing render-blocking JavaScript with safe loading attributes
Defer vs async vs type="module" safe defaults
For most sites, the simplest fix is choosing a safe default for how scripts load.
- Use
deferfor your own scripts that depend on the DOM. Deferred scripts download in parallel, then run after HTML parsing finishes, in document order. This is usually the best default for site-wide bundles and UI code. - Use
asyncfor scripts that are truly independent. Async scripts download in parallel and execute as soon as they’re ready, which can happen before parsing finishes and in a different order than they appear. That’s great for isolated features, but risky for code with dependencies. - Use
type="module"for modern JavaScript modules. Module scripts are deferred by default and have clearer dependency management viaimport. This often reduces ordering bugs compared with a pile of globals. The MDN reference for the <script> element is the best single page to confirm these behaviors.
A practical “safe default” many teams use is: type="module" (or defer) for first-party code, and async for third-party code that does not affect above-the-fold layout.
Common script-ordering pitfalls and how to debug them
Most breakages come from ordering assumptions. Watch for:
- Inline scripts that expect libraries to exist before a deferred file runs.
- Plugins that rely on global variables created by another script that is now async.
- Code that runs before the element it targets exists (DOM not ready).
To debug, check the Console for reference errors, then use DevTools Network “Initiator” and the Performance panel to see which script executes first and what blocks the main thread.
Delaying third-party tags and non-essential widgets
Third-party tags are frequent render-blocking offenders, especially when injected early. If a tag is not required to render above-the-fold content, delay it until after the first render, after user interaction, or once the browser is idle. Also audit duplicates (two analytics tools, multiple pixels, old A/B testing snippets) and remove what you do not need.
This matters for SEO in the AI era, too. When pages become interactive quickly and consistently, both users and automated systems can understand and traverse content with fewer timing issues. The guidance in web.dev’s best practices for tags and tag managers is a solid baseline for keeping tags from dominating performance.
Fonts and resource hints that reduce perceived blocking
Font-display strategies to prevent invisible text
Fonts are a common “hidden” render blocker because text can be delayed while a web font downloads. The fix usually starts in @font-face with font-display, which controls whether the browser shows fallback text first or waits for the font. For most content sites, font-display: swap is a practical default because it avoids invisible text, then swaps in the web font when it arrives. fallback or optional can also work if you want to reduce swapping on slow connections. The key is choosing a strategy that keeps above-the-fold text readable quickly, without causing a big visual jump. MDN’s reference on the font-display descriptor is the clearest description of the trade-offs.
When to preload fonts (and when not to)
Preload fonts when a specific font file is needed to render above-the-fold text, especially if that text is your LCP element (like a large hero headline). In that case, preloading the exact woff2 file can reduce the time to first readable paint.
Do not preload every weight and style “just in case.” Preloading unused fonts wastes bandwidth and can slow other critical downloads. As a rule: preload only what the first viewport truly needs, and let everything else load normally after CSS is applied. Also remember that font preloads often need crossorigin so the preload can be reused by the actual font request.
Preconnect and dns-prefetch for critical origins
If your critical CSS, fonts, or scripts come from another origin, preconnect can save time by starting DNS, TCP, and TLS early. Use it sparingly for truly critical origins (for example, your font CDN), because each early connection has a cost. dns-prefetch is a lighter hint that can help when you are less certain the resource is needed immediately. web.dev’s guide to preconnect and dns-prefetch covers when each hint helps.
For SEO, these small wins matter when repeated measurements confirm them. Faster, more predictable first render makes pages easier for users to read and for AI-driven systems to interpret without waiting on late-loading fonts and third-party origins.
Re-testing changes and confirming improvements in field data
Verifying in Lighthouse and PageSpeed Insights after each change
Treat performance work like debugging. Change one thing, then re-test. If you bundle several fixes at once, you can’t tell what helped or what caused a regression.
In lab testing (Lighthouse or PageSpeed Insights), aim for consistency:
- Re-test the same URL and template (home page vs blog post pages can behave very differently).
- Run multiple times and compare the median, not the best run.
- Test both mobile and desktop, since render-blocking CSS/JS often hurts mid-range phones most.
- Watch for trade-offs: a faster FCP that introduces CLS, or a better score that makes the page feel janky.
PageSpeed Insights is useful here because it pairs Lighthouse lab diagnostics with a clear view of what it considers field metrics and thresholds, which helps teams stay aligned on what “better” actually means. The current definitions and buckets are summarized in Google’s About PageSpeed Insights.
Checking CrUX or RUM for real-user Core Web Vitals
Lab improvements are only half the job. Confirm the change shows up in field data, either through CrUX (Chrome User Experience Report) or your own RUM (real user monitoring).
CrUX data is aggregated and inherently delayed. It represents a rolling 28-day window, so a deploy from this week can take time to fully influence the numbers. That’s normal and it’s why “instant wins” in Lighthouse do not always translate to instant wins in field reports. The CrUX API documentation explains the 28-day rolling average model.
If you have RUM, use it to validate faster. Track LCP, CLS, and INP by page type, device, and connection. This kind of segmentation helps you catch issues that affect real users and crawlers before they appear in aggregated datasets.
Measure render-blocking work with Screpy
Create a repeatable before-and-after record for each page template instead of optimizing a single Lighthouse run.
- Choose representative URLs for the homepage, article, product, category, and application-shell templates.
- Record current lab values and findings: LCP, FCP, TBT, Speed Index, blocking resource URLs, transfer size, and test time.
- Apply one bounded change, such as extracting critical CSS, deferring a non-essential script, or delaying a third-party widget.
- Use Screpy Core Web Vitals monitoring to repeat lab checks for selected public URLs.
- Re-run the Screpy SEO Crawler when asset-loading changes could affect rendering, links, or discovery.
- Compare field data separately when enough real-user data exists. Lab checks are controlled diagnostics, not a substitute for field measurements.
Store the URL, template, test conditions, changed resource, before and after values, visual-regression result, and rollback decision. Keep a change only when the page still renders correctly and repeated measurements show a meaningful improvement.